


Expecting a big move from a stock but not sure of the direction? Then the long strangle option strategy is the trade for you.
Today you’re going to learn how to set up the trade, how to manage it, things to watch for and we’ll also go through some really detailed examples.
Let’s get stuck in!
Contents
- Introduction
- How To Set Up A Long Strangle
- Maximum Loss
- Maximum Gain
- Long Strangle Vs Long Straddle
- When To Enter A Long Strangle
- Exits
- The Greeks
- Long Strangle Examples
- How Implied Volatility Impacts A Long Strangle
- Implied Volatility And Earnings Announcements
- Summary
Introduction
This explosive options strategy can generate big profits in a short period of time, but, like any option strategy that involves owning long options, time is against you.
The big move needs to happen sooner rather than later, otherwise you will find your position slowly eroding each day from the dreaded time decay.
The long strangle also has a huge exposure to implied volatility. All else being equal, the trade will make money if implied volatility increases after opening the trade and lose money if implied volatility decreases.
Even if the stock doesn’t move, a spike in implied volatility due to an unforeseen event, might allow the trader to close out the position early for a profit.
How To Set Up A Long Strangle
A long strangle is constructed by buying an out-of-the-money put and an out-of-the-money call with the same expiration date.
Traders might prefer the long strangle over the long straddle due to the reduced cost. However, they will need a bigger move from the stock in order for the trade to be profitable at expiry.
How far out-of-the-money to place the call and put would depend on the trader’s outlook for the stock and how much money they are willing to risk.
Typically traders will place the calls and puts an equal distance away from the stock price. For example, it a stock was trading at $50, a trader might buy a $45 put and buy a $55 call.
PICKING A PRICE TARGET
If a trader was expecting a 10% move in the stock, they would want to place the strangle within that range.
A strangle that has the two legs 10% away from the current price, will require a move of greater than 10% (at expiry) in order to profit due to the cost of the trade.
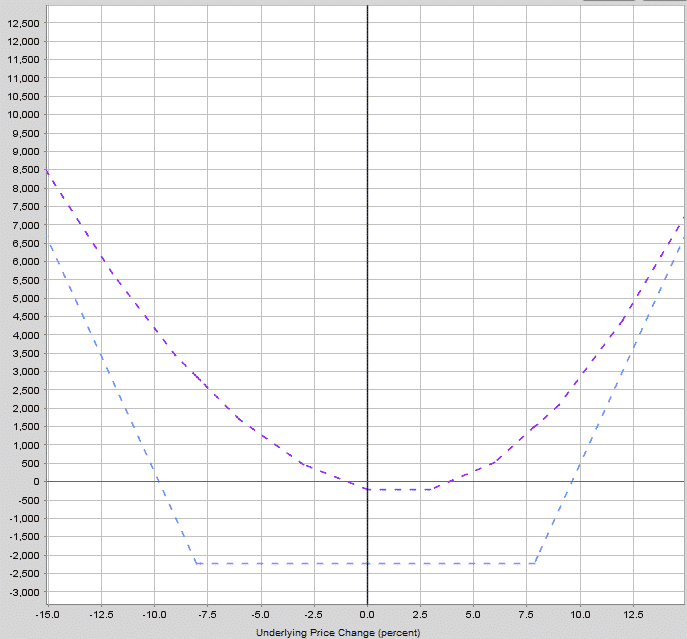
However, this trade could still be profitable before expiry if there is a big move. This can be seen in the image below.
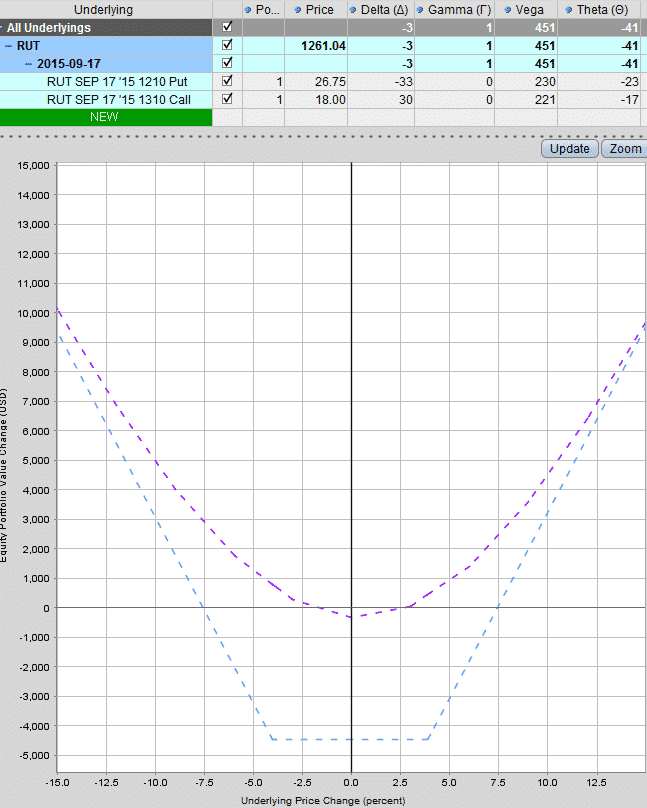
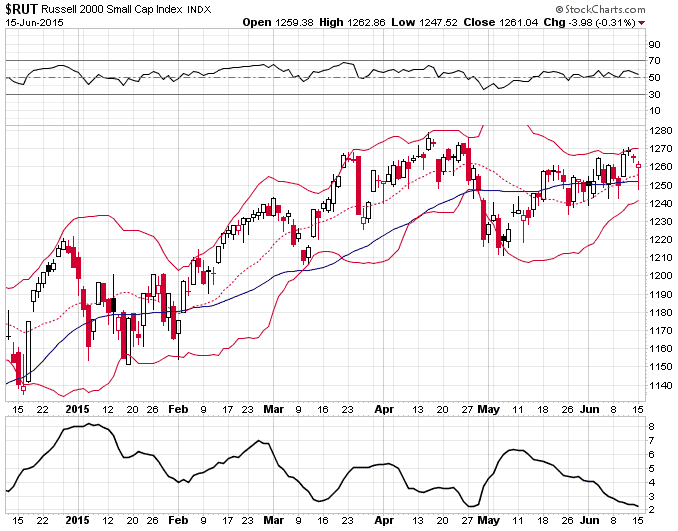
This trade was set up on June 15th, 2015 on RUT. The blue line represents the profit or loss at expiry and the purple line represents the profit or loss one week from trade initiation.
You can see that a sizable profit is achievable one week after opening if the index moves about 5%. To make the same profit at expiry, the index needs to move over 7.5%.
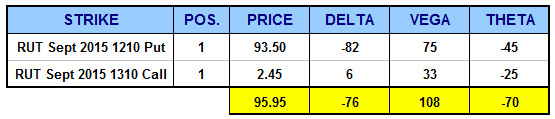
The strikes for this trade were just an arbitrary 50 points above and below the index price. Notice that because of the volatility skew, the 1210 put is significantly more expensive than the 1310 call.
USING DELTA
Another way to select the option strikes is to use delta as a guide. Delta can be used as a rough estimate of the probability of the stock reaching that strike at expiry.
For example, a strangle trade that uses strikes with deltas around 0.30 and -0.30 has a roughly 30% chance of expiring in-the-money.
In the example above the deltas were 0.30 and -0.33. To make the trade completely delta neutral, you could swap the 1210 put for a -0.30 delta 1200 put.
That way, the trade would start perfectly delta neutral, although it won’t stay that way for long. As the underlying index moves, the net delta on the trade will move to either positive or negative depending on which way the index moved.
Maximum Loss
The maximum loss on this trade is limited which is great, but a trader would not want to experience a 100% loss on this trade given the large amount of capital required.
Straddles and strangles are expensive and need to be managed carefully to avoid significant loss. Dan Nathan from Risk Reversal provides a good example of using a short straddle to offset the cost of a long strangle. This article is well worth a read if you are concerned about the cost of a long strangle trade.
The maximum loss will occur if the stock finishes between the put and call strikes at expiry. In this case both the put and call will expire worthless and the trader would experience a total loss.
Maximum Gain
The maximum gain on a long strangle is theoretically unlimited on the upside. On the downside the maximum gain is still substantial but is limited by the stock only being able to go to $0.
Long strangle trades can see substantial gains if the stock makes a big move in either direction.
Long Strangle Vs Long Straddle
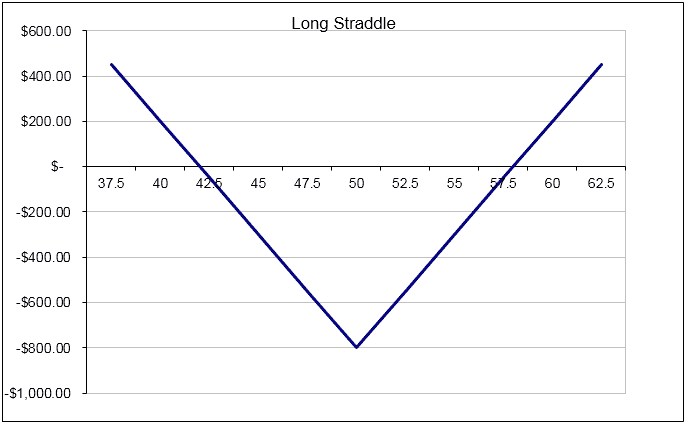
With a long strangle, the options are placed out-of-the-money, whereas a long straddle uses at-the-money calls and puts. The straddle trade acquired its name due to the fact that the calls and puts “straddle” the one strike.
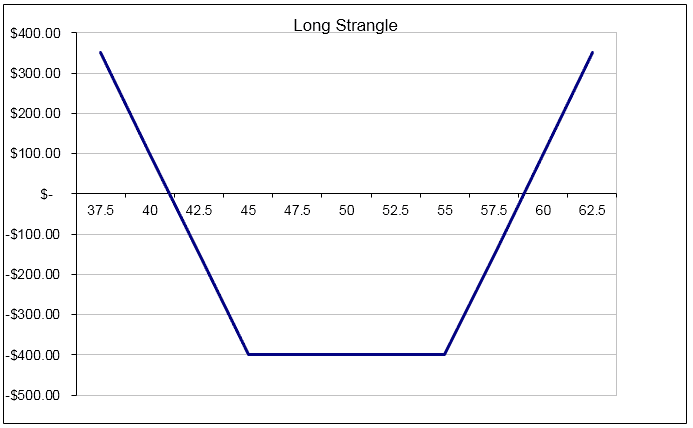
The strangle trade places the calls and puts on either side of the stock price and “strangles” the underlying stock or index. You can see the difference in the trade setup in the two images below.
You can see that the straddle is more expensive because you are trading the at-the-money options which have the highest time premium component.
The long strangle is a cheaper trade to place, but requires a larger move before reaching the breakeven point.
In this example, the straddle costs $800 and has breakeven points at $42 and $58 while the strangle costs $400 and has breakeven points at $41 and $59.
When To Enter A Long Strangle
The long strangle is a trade which requires a large move in the underlying stock in order to be profitable. As such, one good entry criteria could be to wait until the stock has had a long period of sideways consolidation before entering the trade.
Generally, stocks tend to revert to their long term average movement, so after a quiet period, the stock could be ready to make a big move.
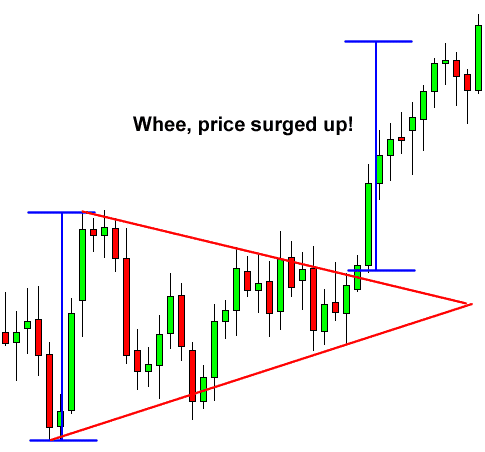
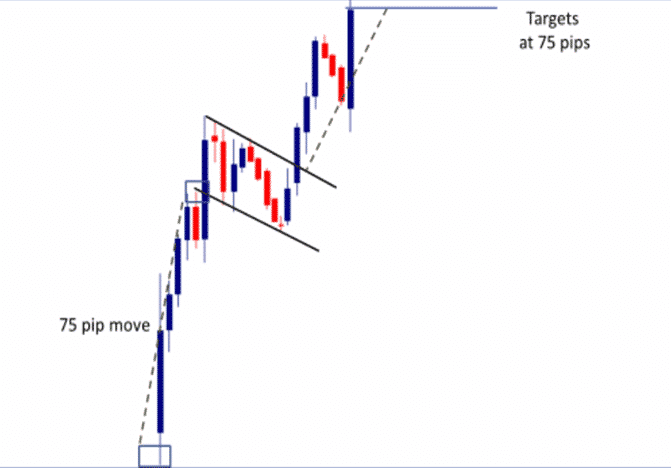
Various chart patterns and techniques can be used to help guide you in when to enter these trades. Triangles, Channels, Wedges, Flags and Pennants are all relevant chart patterns that could be used for an entry criteria.
These patterns all exhibit similar characteristics in that the stock is either range bound or coiling in a tighter and tighter range, just before it breaks out. If you feel like a stock is ready to breakout, but are not sure of the direction, a long strangle is a great trade.
Here are some examples:
SYMMETRICAL TRIANGLE AND BREAKOUT
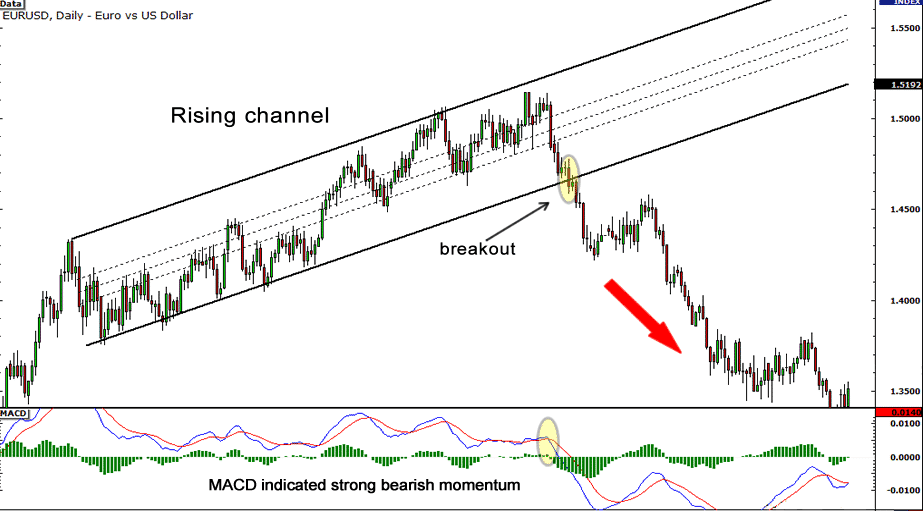
CHANNEL AND BREAKOUT
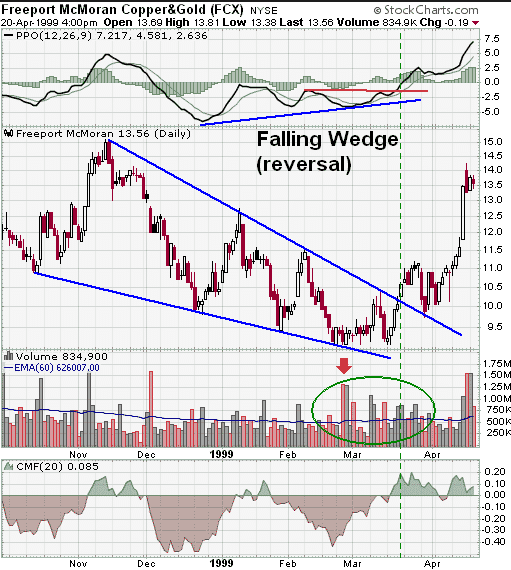
WEDGE PATTERN AND BREAKOUT
FLAGS, PENNANTS AND BREAKOUTS
More About Entries
Another important part of trade entry with a long strangle is to take a look at the current and expected level of implied volatility which we will discuss in more detail shortly.
As straddles and strangles are long volatility trades you want to enter them when volatility is low and expected to rise.
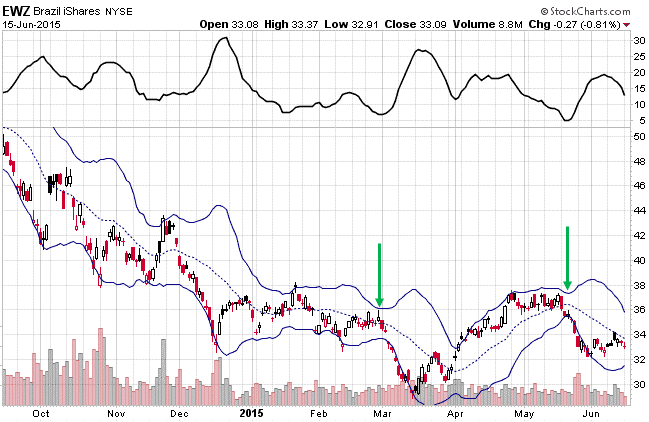
One of my favorite entries for a long strangle trade is when you see a Bollinger Band squeeze.
This works especially well when the Bollinger Band Width is near the lowest point seen in the last 6 months and when the stock price is near the middle of the very narrow Bollinger Bands.
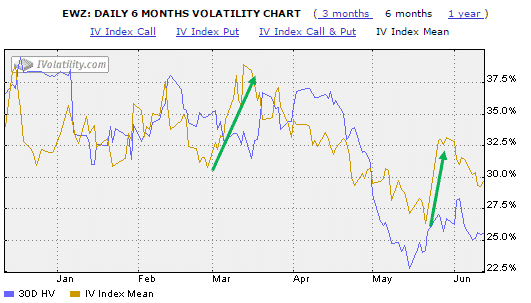
In the EWZ chart below, you can see two very favorable entries based on these criteria.
The first signal saw a move from $34.50 down to below $29 in 9 trading days. That’s a 16% move, and the fact that it occurred on the downside would have given a long strangle an even bigger boost due to the implied volatility expansion.
Around that time, implied volatility moved from 31% to 38% which really helped the long strangle trade. Remember long strangles are positive vega and therefore benefit from a rise in implied volatility after the trade is placed.
The second signal occurred in mid-May and saw an 11% move from $36 to $32 in 10 trading days. Again, this occurred with an accompanying rise in implied volatility which gave the trade an extra boost. During this period, implied volatility rose from 26% to 32.5%.
These types of setups and moves only tend to occur a few times per year, but when you do catch them, the results can be outstanding.
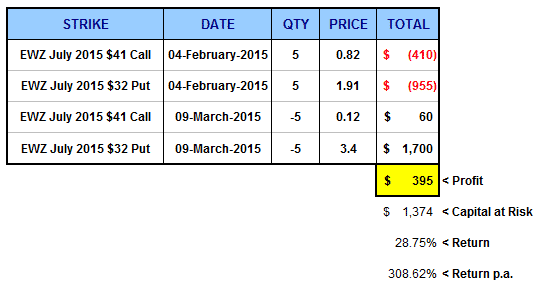
I placed a long strangle trade on EWZ in my own account, although I was a few weeks early on the entry.
You can see below that even though I entered the trade on February 4th, I still made a handy profit. This profit would have been much larger if I had entered the trade towards the end of March.
Exits
It’s great when a trade goes to plan and you can take a profit. Generally, for a long strangle trade, I am happy with a 20-25% return on capital at risk and will tend to take profits at that stage or slowly scale out of the position.
On the downside, I tend to stick to a 20% stop loss.
Long strangles are a very theta intensive strategy and as time passes, the amount of time decay you suffer will increase exponentially. For this reason, it makes sense to close out long strangles once 1/3 of the time to expiry has passed. If neither my profit target nor stop loss have been hit, but this much time has passed, I typically close the trade to avoid the losses from time decay that are accumulating.
The Greeks
It goes without saying that the long strangle is a long volatility play. You’re looking for a big move in either direction, or a jump in implied volatility. The battle is between capturing that move, against the effects of time decay as each day passes.
The actual greeks will vary depending on how the trader sets up the trade, but typically most traders start off delta neutral or close to it. Vega will always be positive and theta will always be negative.
Let’s work through some scenarios together. The following three RUT long strangle trades were set up on June 15th, 2015.
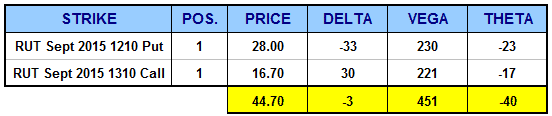
The following three trades were placed when RUT was trading around 1260. The first trade was 3 months in duration and the strikes were placed 50 points out of the money. Here’s how the greeks look.
Long Strangle Examples
Trade 1 – Sept 1210 – 1310 Long Strangle
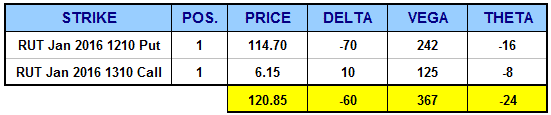
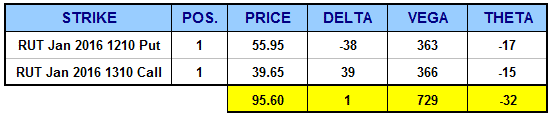
Here’s what the greeks look like if we use the same strikes but go out to January 2016.
Notice that delta is pretty similar and more or less neutral, no major change there. Theta has come down a bit. As we have gone further out in time, the impact of time decay on the trade is not as great.
Vega has had a significant impact jumping from 451 to 729. So, by going out further in time, we have slightly reduced the time decay, but we have taken on a much greater exposure to changes in implied volatility.
What happens if implied volatility drops after we enter these trades instead of rising like we anticipated? The longer term trade (January expiry) would perform much worse as the impact of changes in implied volatility is greater.
Trade 2 – Jan 1210 – 1310 Long Strangle
This time, instead of going further out in time, we move the strikes out further while staying in September to make the trade a bit cheaper?
The first thing you should notice is that the implied volatility skew has become much more pronounced. The puts that are 100 points out of the money cost $17.15 as opposed to 100 point out-of-the-money calls at $5.05.
As such the delta on the trade has become much more skewed to the downside. We now have -9 delta as opposed to -3 on Trade 1 and +1 on Trade 2.
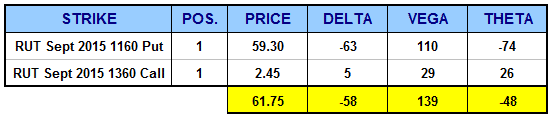
Trade 3 – Sept 1160 – 1360 Long Strangle

Going further out from the index price has made the trade cheaper ($2,200 as opposed to $4,470), and our Vega exposure has dropped by about 30%, as has our theta. That’s all well and good, but with this trade, we would need the index to move further to be profitable at expiry.
In the short-term though (1-2 weeks), there isn’t a huge amount of difference. So, if you can really nail your timing, the further out-of-the-money strikes could potentially be more profitable on a percentage basis. But, you would have to be pretty spot on with your timing.
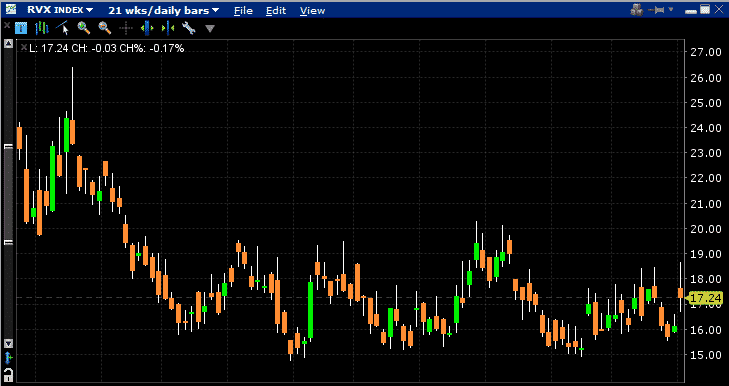
Here is the RUT and Russell Volatility Index as of June 15th, 2016 for reference.
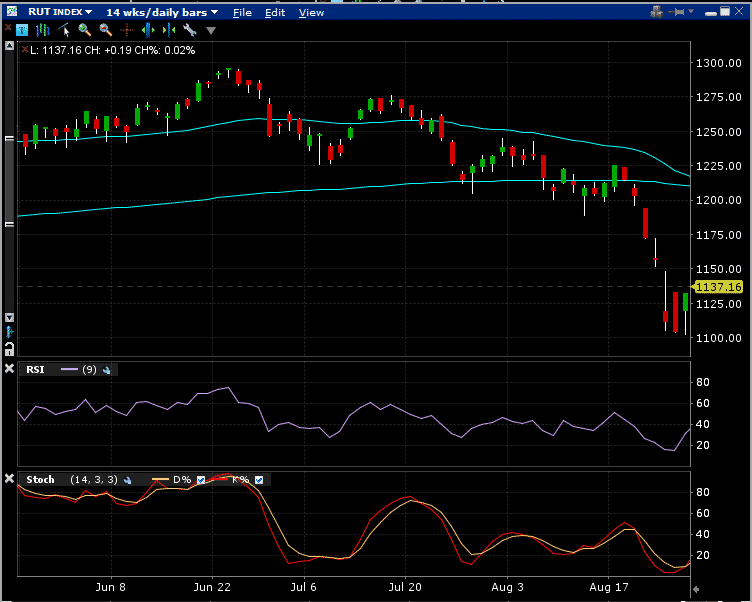
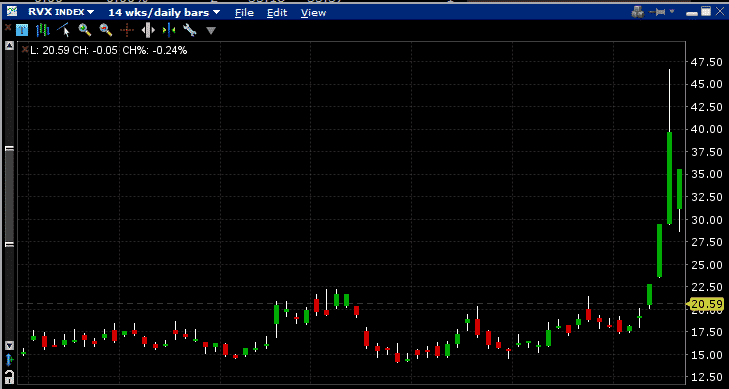
10 Weeks Later
On August 24th, stocks experience a precipitous drop, with RUT falling to near 1100. This is a pretty big move from 1260 which is where RUT was trading when we initiated the trades. The majority of the decline occurred in mid-August, so you can see that things can develop quickly which is ideal for a long strangle.
Also notice that implied volatility skyrocketed, another massive bonus for a long strangle. Over the course of just a few days, RVX jumped from 17.50 to 47!! How do you think our long strangles performed in this scenario? Let’s take a look.
Trade 1 – Standard trade +$5,125 or 114%
Trade 2 – Further out in time +$2,525 or 26%
Trade 3 – Further out in price +$3,955 or 178%
You can see above that the two shorter-term trades (Sept) were the best performers in both dollar and percentage profit, both returning well over 100% on capital invested. This is interesting given that the January trade had the higher starting Vega.
Also note that after the decline, all three positions have a large negative delta. This is because the calls have very little value left and are very far out-of-the-money. Most of the value in the long strangle is in the puts. If the market bounced from here, the profits on the trades would quickly start to reverse. Definitely time to take profits!
How Implied Volatility Impacts A Long Strangle
Implied volatility is a very important component of a long strangle. In the first example we looked at, vega was by far the dominant greek. If you refer back, you can see delta was -3, gamma was 1, theta was 41 and in comparison, vega was a whopp1ng 451! Therefore traders need to be aware, that changes in implied volatility will have a big impact on this trading strategy.
After entering the trade, if implied volatility rises, that will be very good for the trade, and the owner of the long strangle might be able to receive a higher premium when they sell to close the trade.
Volatility cuts both ways though, and if a fall in implied volatility occurs after the trade is opened, the value of the long strangle could fall significantly.
Implied Volatility And Earnings Announcements
One trade that works well is opening a long strangle a few weeks prior to an earnings release. Many times you will see implied volatility at low levels a few weeks out from a stock’s earning’s report.
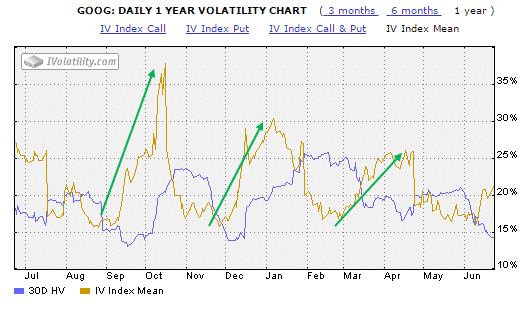
Volatility then starts to rise as anticipation and uncertainty about the earnings report comes closer. You can see this very clearly in the chart of Google’s implied volatility below.
There is a clear rise in implied volatility leading up to earnings releases in October, January and April.
Following the earnings release, implied volatility drops dramatically, so the trader would want to close the long strangle before the announcement.
Unless of course they are expecting a really big move in the stock.
The volatility drop following an earnings announcement is very common, you can see a good example with NFLX here.
Summary
The long strangle option strategy is a powerful strategy that can result in significant gains, but also has high risks. Some things to keep in mind include:
- Long strangles have are a strategy that can produce large profits but also have the potential for big losses
- You don’t need to predict which way the stock will move, only that it will make a big move shortly after you enter the trade
- It is possible to make a profit from increases in implied volatility, even if the stock price does not change
- The initial cost of the trade is high compared to other option strategies, but is still lower than the long straddle
- The passage of time is not good for this trade. Traders need to stock to move (or implied volatility to rise) before too much time decay kicks in
- Just as increases in implied volatility help the trade, decreases in implied volatility will hurt the trade
Let me know in the comments below if you have ever tried this strategy or if you plan to try it in the near future.
Happy trading!


Gavin,
Good to hear from you. Sir, you are the best. My good fortune to have you as one of my teachers.
And my good fortune to have you as a reader and student. 🙂
Hello Gavin,
Very detailed and highly informative article. I have been doing earnings trade using straight Call or put options. So far, my performance is mixed. I am planning to try the long strangle during this qtr. My question is on the STOP LOSS. In case, I go for a straight Call or Put with a STOP LOSS order(GTC) one day before the earnings day and when the stock gaps up or down, does the STOP LOSS work or get ignored?
Hi Ravi,
It depends what sort of stop loss order you use. If you use a stop market you will get closed out wherever the market open and you will pay the entire bid-ask spread. A stop limit order would likely not get filled.
Hope that helps, this article may also be of interest to you.
https://optionstradingiq.com/are-you-shark-bait/
Hi Gavin,
Thanks for this article. In it, you mention “Dan Nathan from Risk Reversal provides a good example of using a short straddle to offset the cost of a long strangle.” I was not able to find this article on his site. Do you remember his idea in a nutshell – i.e., does he sell the straddle in a front expiry vs. buying the strangle in a later expiry? – Bill
Yes, that’s the basic idea. His article is not longer available for some reason. I wrote about the same concept here in detail which you might be interested in:
https://optionstradingiq.com/calendar-straddle-option-strategy/
Hi Gavin, is there any way to adjust the strangle or straddle when they remain loss status?
Greeting from Alex.
I generally set a dollar based stop loss and a time based stop loss. I tend not to adjust them.
I found you is my good luck.There could’nt be better way to understand options than yours. Thanks.