
Running this website does have it perks at times, and sometimes that involves getting free stuff.
At the start of this year, Michael Lamothe invited me to try out some of the offerings from Chart Your Trade.
Lamothe is the founder of Chart Your Trade and is also a fund manager and private investor. Some of the tools and scanners he has developed automated his three hours a week process for analyzing stocks.
Within Chart Your Trade, there are three different Products and Services – MRI Scanner, Elite Stock Setups and Advanced Stock Reports.
MRI Scanner
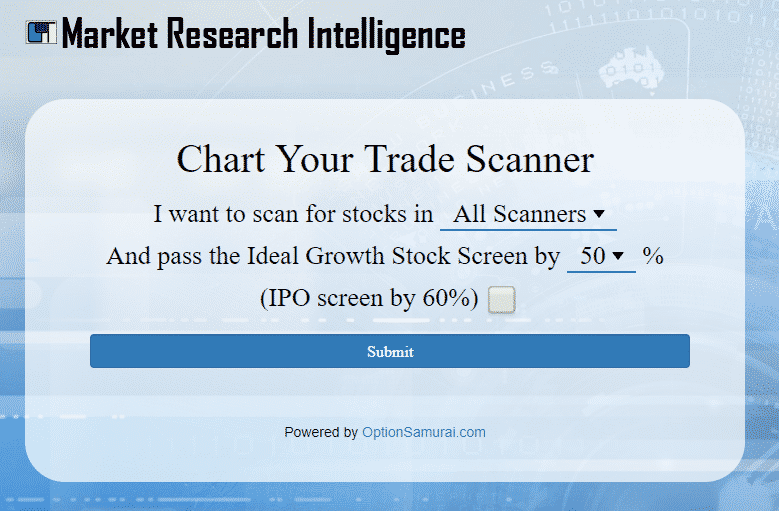
This app is an awesome way to scan the overall health of the market as well finding some of the best growth stocks.
When you log in to the scanner, you can choose to run it for All Scanners or specific scanners such as Relative Strength, Accelerated Earnings, Fund Ownership, Sector Leader and Super Sales.
After running the scanner you get a list of stocks that passed. This is useful for a couple of reasons. Firstly, it shows you the leading growth stocks in the market and secondly, it shows you the overall strength of the market generally – if the numbers of stocks passing the scan is increasing, that’s a sign of underlying strength in the market.
As Lamothe says – “As the list expands, the market internals ‘under the hood’ are getting stronger. As the list contracts, the internals are starting to get weaker.”
This can be an important indicator for investors to know when to increase or decrease equity exposure.
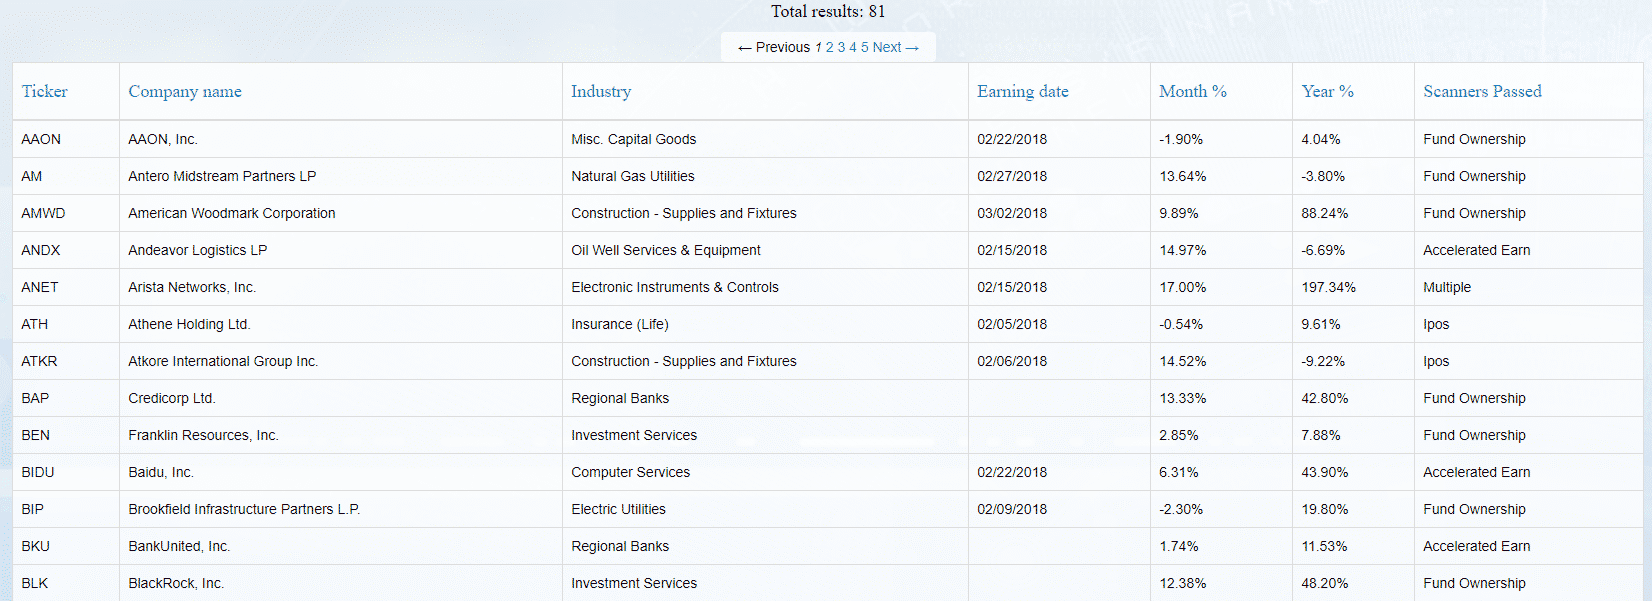
Hovering over the ticker symbols will bring up the chart of the stock, which is quite a cool feature. So it really does take seconds to drill down into the strongest stocks in the market and then see the chart all in one place. You can also export the list into excel.
Here is some further information from Lamothe about the MRI Scanner:
“On of the things that lead to my trading success was being able to identify broader themes in the market. Stocks often travel in packs. They say “birds of a feather flock together”…well, the same is true of stocks! When multiple stocks from the same industry group begin passing our scans simultaneously, it’s a sign that something is happening within that industry group and it warrants us to take a closer look at the stocks within that group. Often we’ll see several stocks within that group setting up in similar basing patterns. When this happens, it could be signaling a group move. If that’s the case, hang on to your hats!”
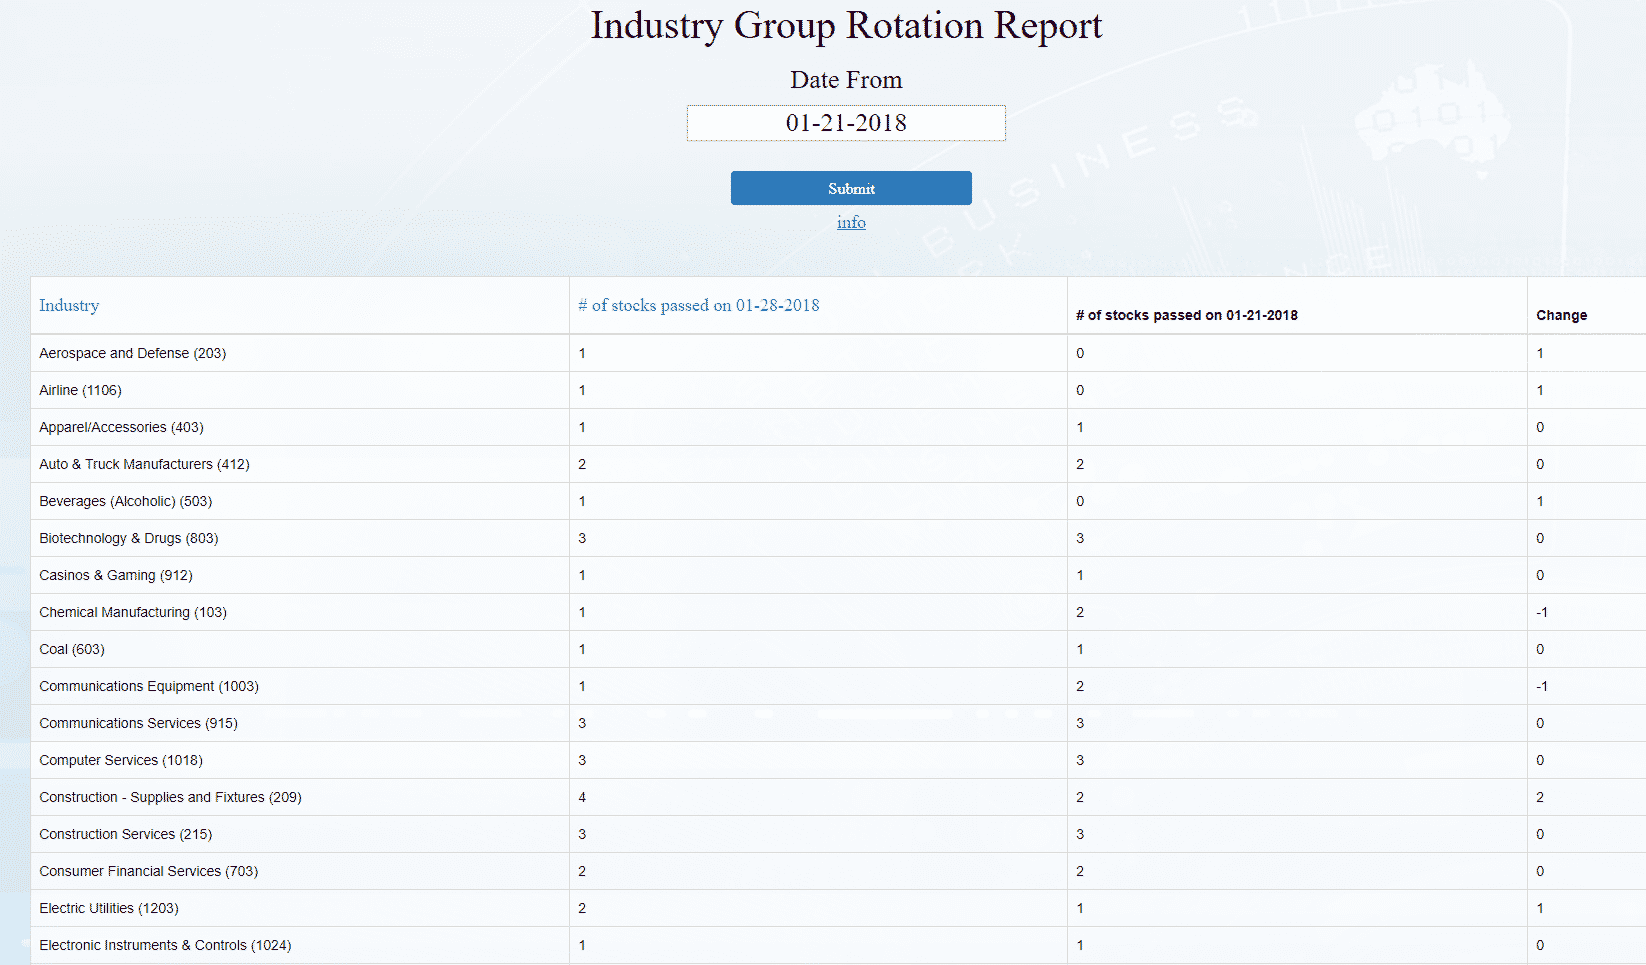
Another feature of the MRI Scanner is the Industry Group Rotation Report. This scanner shows how many stocks from each industry have passed the scanner compared to a particular date in the past. Knowing where the money is flowing into or out of can be crucial for success.
Lamothe also has detailed instructions on how to export the data into excel and organize it into an extremely user-friendly format. See below:
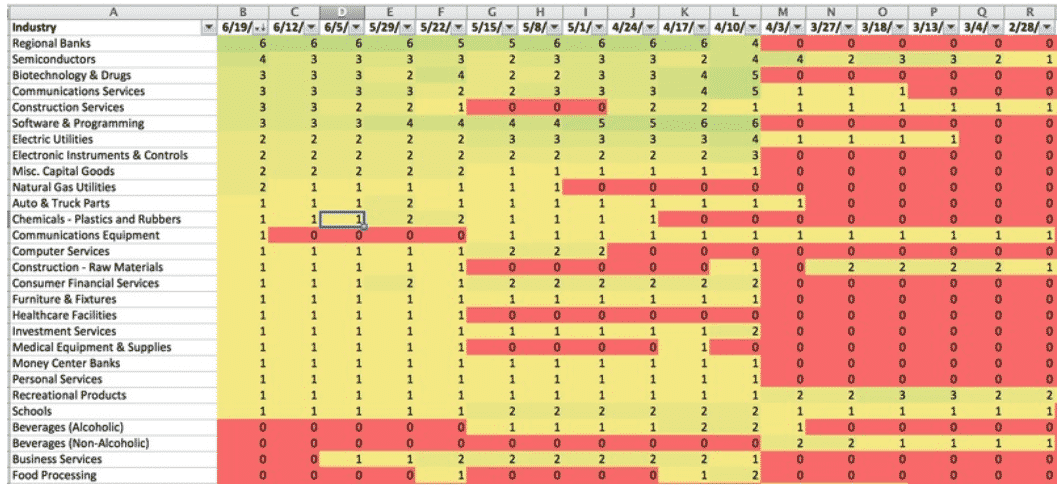
This heatmap takes minutes to maintain and gives a clear indication of money flow. For example, in the above screenshot, we can see that in April money started from into Regional Banks and that sector remained strong for the next two months.
Really useful information to have for any put sellers out there.
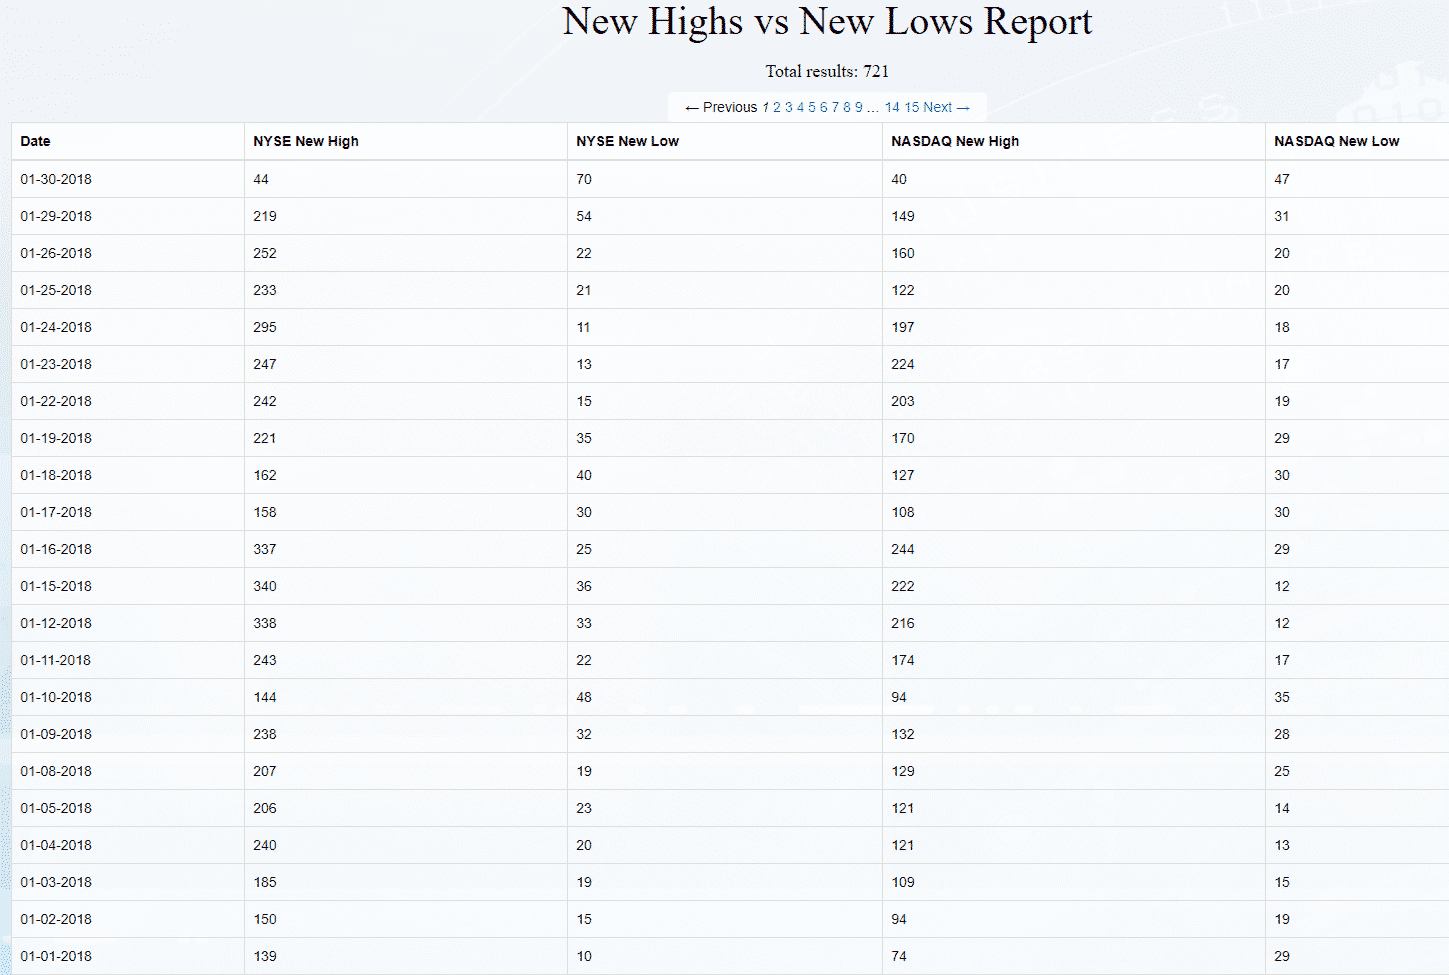
The final part of the MRI scanner is the New Highs vs New Lows Report. Again, this gives a really quick snapshot of the strength of the market
Here’s what Michael has to say:
“By monitoring the New Highs vs New Lows list every day or even every week, we can see how robust the market’s trend truly is and if it is about to change! I’ve personally captured numerous trend changes through this sort of analysis.”
The price for the MRI Scanner is $19 per month or $199 per year, but you can get the first month free using this link and the coupon code “1dollarscan”
Elite Stock Setups Membership
Elite Stock Setups is a report authored by Adam Sarhan who has over 20 years of stock market and portfolio management experience. You may have seen him on CNBC and Fox Business.
The report contains Adam’s best 10 stock setups including entry points and full technical and fundamental analysis.
Here is an example from Feb 10th:
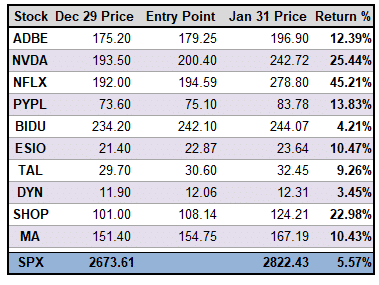
Below are the stock movements for the 10 stocks between Dec 31 and Jan 31:
As you can see, I think the results speak for themselves. All 10 stocks were winners and only 2 underperformed the S&P 500 in that time. The majority of them saw significant outperformance!
The price for Elite Stock Setups is $47 per month or $497 per year.
Advanced Stock Reports Membership
This report is sent to member three times per week – one full weekend report and two intra-week updates.
The weekly report is broken down into 5 sections:
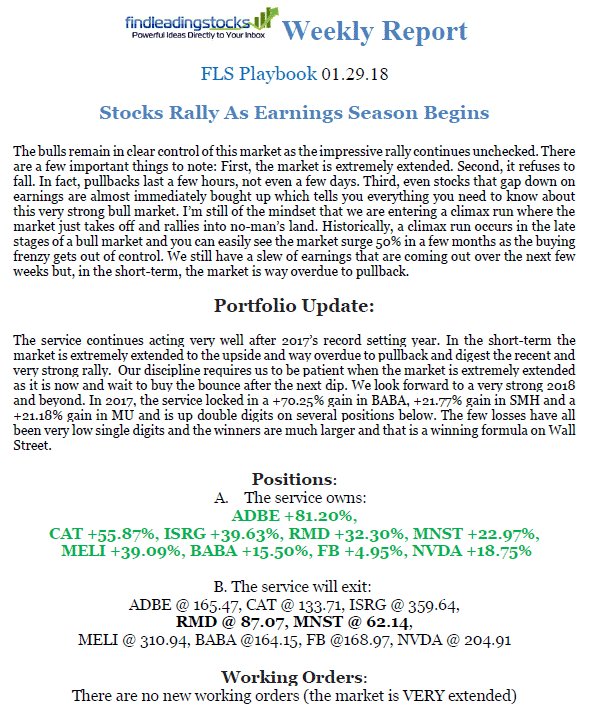
- FLS Playbook – This section contains a quick summary of the market action and conditions as well as details of what positions are currently held in the portfolio and stop loss levels. This section also contains working orders that Adam and Michael are watching.
- Recent Pullbacks & Rallies / Chart of the Week – This section contains some of the most relevant themes influencing the market for the week.
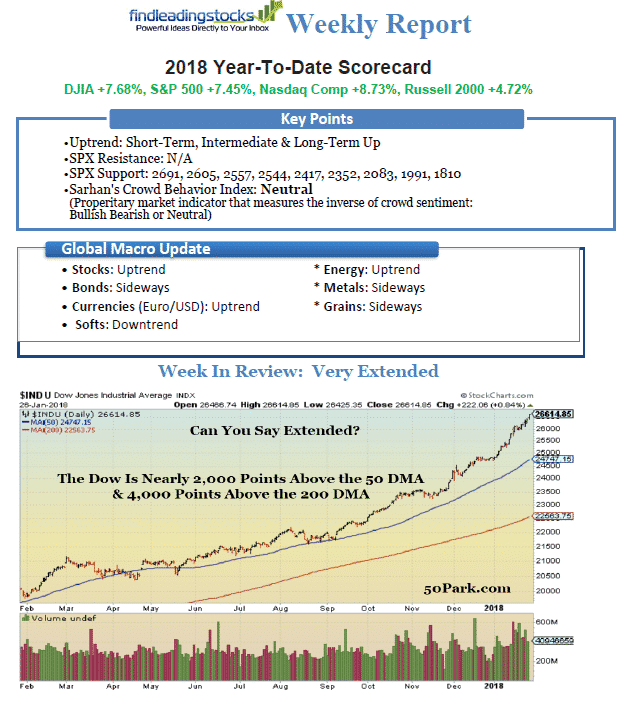
- Year to Date Scorecard and Weekly Review – This section gives a quick snapshot of the market, important support and resistance levels as well as trend analysis.
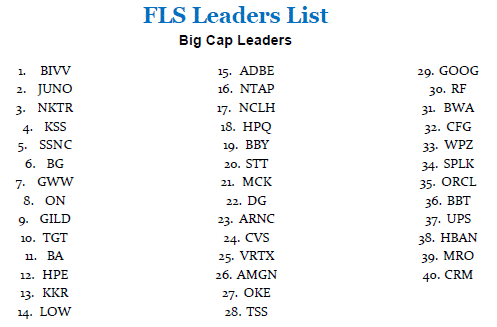
- FLS Leaders List – Similar to the IBD Leaders list, this section shows the current leading big cap stocks in the market.
- Elite Stock Setups – This is the same report from the Elite Stock Setups Membership showing the 10 best stocks to watch with detailed analysis including entry points.
The price for Advanced Stock Reports is $97 per month or $997 per year.
Overall I found the tools from Chart Your Trade very useful. The MRI Scanner is an awesome way to get a quick snapshot of market strength while also showing the leading growth stocks. IT’s also very affordable at only $19 per month.
The results from Elite Stock Setups speak for themselves with some amazing returns during the sample period.
The added bonus you get if you sign up for Advanced Stock Reports is that you get open access to Michael and Adam for 3 months. You can pick their brains as much as you like.
The guys are giving a deal to Options Trading IQ readers on the Advanced Stock Reports of 3 months for $27, go to this page and use the code “3for27”.
Also, if you want to try the MRI Scanner you can get the first month for $1 here using the coupon code “1dollarscan”.
If you sign up, let me know what you think of the service.
Trade safe!
Disclaimer: The information above is for educational purposes only and should not be treated as investment advice. The strategy presented would not be suitable for investors who are not familiar with exchange traded options. Any readers interested in this strategy should do their own research and seek advice from a licensed financial adviser.