


Today, we’re going to take a deep dive into technical analysis. I’ll show you some of the key things you should learn and I’ll also show you the best sources to learn from.
Enjoy!
Contents
- Introduction
- Technical Analysis Courses
- Technical Analysis Books
- Trend Following
- Chart Patterns
- Charts
- Candlestick Patterns
- Technical Indicators
- Technical Analysis Opinion Articles
Introduction
Technical analysis forms the foundation of market speculation for trading in financial markets. It is also the product of hundreds of years of market data—concepts like candlestick techniques were developed as far back as the 18th century.
In contrast to fundamental analysis, which examines aspects of a company’s stock such as earnings, dividends, ratios, and assets, those that employ technical analysis seek to find price patterns and market trends in order to profit off them.
This is no simple task.
The methods and techniques used can be overwhelming. A beginner should be prepared to enter the complex world of multiple indices, moving averages, trend following, indicators, and oscillators.
But where should you start and what does it all mean?
Behind all the charts, graphs, and mathematic formulas, there are basic concepts that apply to most of these tools and techniques. With a solid grasp on the fundamentals, any beginner can become a technical analyst and take his trading skills to new heights.
Listed below, this blog post has filtered out the noise and outlined the best resources out there in taking on the quest of mastering technical analysis.
Technical Analysis Courses
Investing Teacher:
A first of its kind interactive experience that teaches stock charts start to finish. Investing Teacher provides completely interactive content including drawing trendlines on charts, drag and drop, built for tablets, interactive questions, and more. The guide consists of 28 chapters, teaching everything there is to know about stock charts. From the basics of what a stock chart is to identifying Cup & Handle formations.
Tradimo: Technical Analysis
http://en.tradimo.com/learn/technical-analysis/
Free site for beginners to technical analysis, covering a wide range of topics, indicators, and strategies.

Advanced Technical Analysis Course
http://www.investoo.com/advanced-technical-analysis/
Free for registered users this course covers trendlines, candlestick patterns, charts, reversal patterns, and more. Introduction to support and resistance, trend lines, chart patterns, harmonic patterns; how to use technical analysis to set stop-loss, limit orders, and take profit levels.

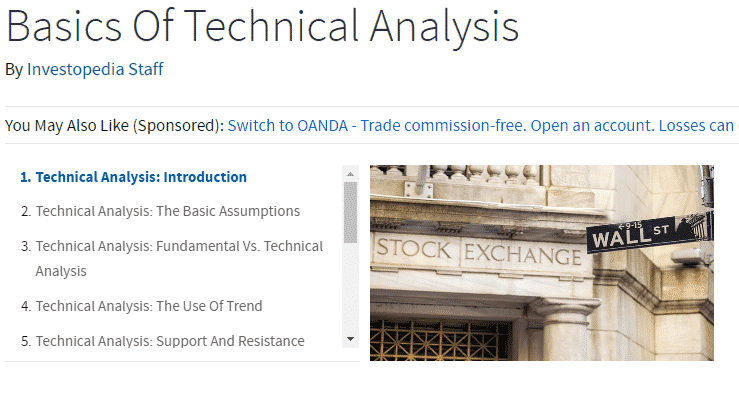
Basics of Technical Analysis:
http://www.investopedia.com/university/technical/
This free course offers a comprehensive introduction and overview of technical analysis, applying fundamental concepts and techniques to understand the foundation of the study. It provides a good foundation through 12 lessons including the use of trend, support and resistance, chart types, chart patterns, moving averages, indicators, and oscillators for the beginner in order to understand more advanced concepts down the road.
Technical Analysis Books
Technical Analysis Explained by Martin Pring
Considered by many to be the “Bible” of technical analysis. The book, in fact, goes well beyond just explaining technical analysis, addressing subjects such as the structure and interconnection of financial markets and trading psychology.
First published in the 1980s, the book remains a favorite with technical traders.
Download the Slide Presentation
Encyclopedia of Chart Patterns by Thomas Bulkowski
The title of Thomas Bulkowski’s book is not an overstatement, as it does provide truly encyclopedic coverage of technical chart patterns by the well-known chartist and market analyst.
Bulkowski presents extensive explanations on virtually every candlestick charting pattern ever identified, and goes further by providing statistical information on how often each pattern has proved correct in predicting future price movements in both bull and bear markets.
The updated version of the book also includes a section on event trading that shows technical patterns related to news events such as major economic data releases and company earnings reports.
How to Make Money in Stocks by William O’Neill (Founder of Investor’s Business Daily)
Considered a classic work on technical analysis, and is a trading bestseller partly because it was written by William O’Neill, founder of the financial newspaper, Investor’s Business Daily. O’Neill, a strong advocate of technical trading methods, studied over 100 years of stock price movements, going all the way back to 1880, in researching the book.
In it, he presents a variety of technical strategies that can be applied to trading stocks, commodities, ETFs or the forex market, along with tips on minimizing risk and identifying the most advantageous risk/reward situations, and on identifying favorable entry and exit points for trades.
O’Neill also explains his own CAN-SLIM technical trading strategy that he used to amass a fortune through trading in the 1960s.
Technical Analysis Using Multiple Timeframes by Brian Shannon
Brian Shannon’s book has wide appeal for technical traders because it can be helpful to traders regardless of what specific technical trading strategy, or strategies, that they may be using. Shannon’s book points out the value of applying technical analysis across multiple timeframes in order to identify trades with the highest probability of success. The book also goes well beyond what its title indicates, including coverage of subjects such as short selling, proper placement of stop-loss orders and identifying target prices for maximally profitable trade exits.
Technical Analysis of Financial Markets by John J. Murphy
Considered as an outstanding reference that has already taught thousands of traders the concepts of technical analysis and their application in the futures and stock markets.
Covering the latest developments in computer technology, technical tools, and indicators, the second edition features new material on candlestick charting, intermarket relationships, stocks and stock rotation, plus state-of-the-art examples and figures. From how to read charts to understanding indicators and the crucial role technical analysis plays in investing, readers gain a thorough and accessible overview of the field of technical analysis, with a special emphasis on futures markets.
Revised and expanded for the demands of today’s financial world, this book is essential reading for anyone interested in tracking and analyzing market behavior.
Trend Following
How to Spot the Stock Market’s Trend Before It Is Obvious To All
This article highlights how to spot when times are changing “for real”, and a longer trend is developing, by focusing on the signs of underlying strength or weakness.
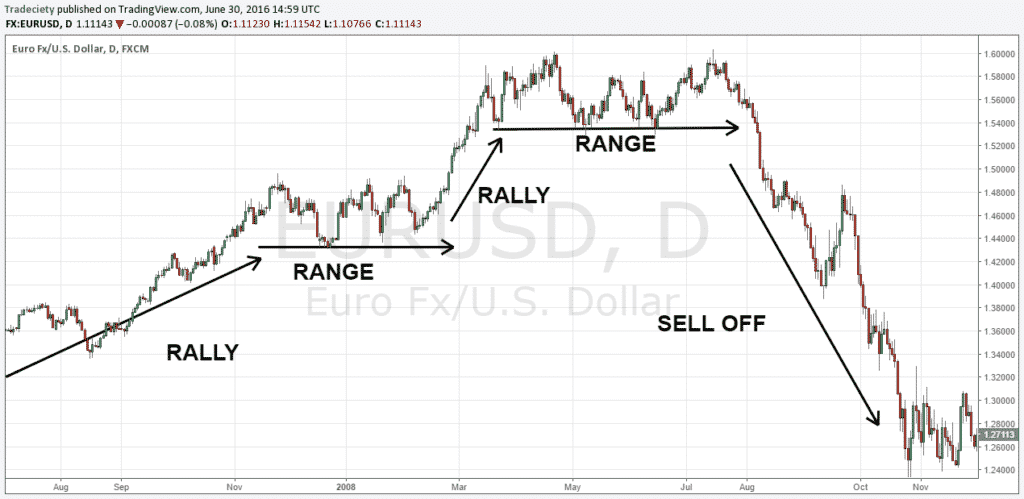
5 Ways to Identify the Direction of the Trend
http://www.tradeciety.com/how-to-know-direction-of-the-trend/
This article introduces the most effective ways to analyze a chart to be able to correctly read price action, trends, and trend direction. It introduces different market phases, line graphs, moving averages, highs and lows, channels and trend lines, and the ADX indicator.
It argues that success in trend following lies in choosing your tools, how well you understand them, and how good you are when it comes to applying them to live market conditions.
John Murphy’s Ten Laws of Technical Trading
Popular author, columnist, and speaker on technical analysis, John Murphy outlines his top recommendations for beginners in this simple, but to the point essay on trend following.
These points are based on questions and comments he has received over the years after speaking to various audiences on technical analysis. This article provides an understanding of basic concepts that apply to most of the theories employed by today’s technical analysts.
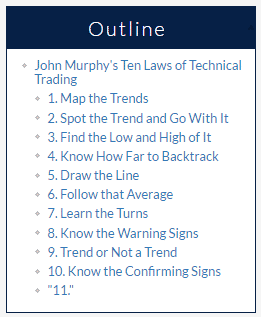
Chart Patterns
Smart Chart Reading: How to Locate a Double-Bottom Base
This article explains how a stock might appear to form a cup base, but then the pattern might just fall apart. It argues that you should leave the stock a while longer and it may form a double-bottom base instead because this pattern can lead to big gains in the market.
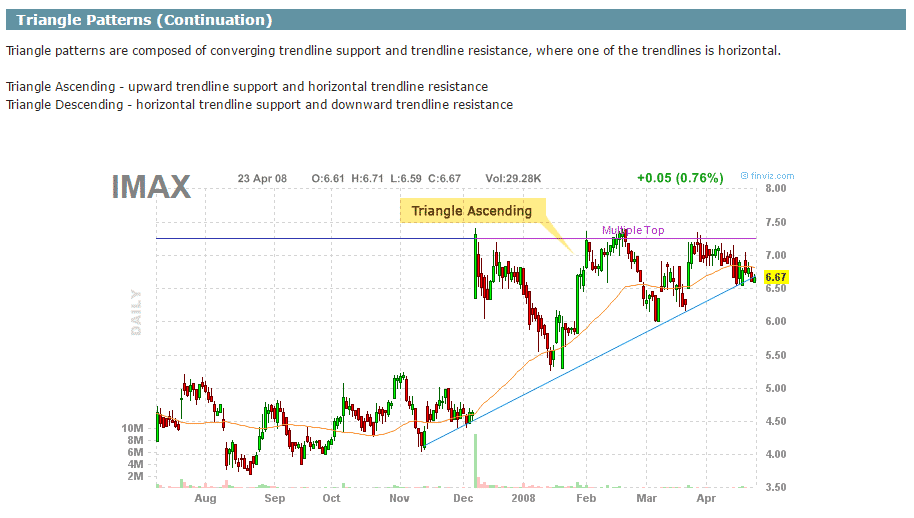
Charts
http://finviz.com/help/technical-analysis/charts-patterns.ashx
Reviews the different types of chart patterns, including trendlines, wedge patterns, triangle patterns, channel patterns, double top, multiple top, double bottom, multiple bottom, and head and shoulders patterns.
Candlestick Patterns
An Investor’s Guide to Candlestick Patterns
http://marketrealist.com/2014/12/candlestick-patterns/
This comprehensive set of articles guides a beginner investor through the definition of candlestick patterns, the different types, understanding certain patterns, and how to use them in analysis. The series is accompanied by charts and graphs and is broken up into 10 sets of mini articles that flow down the page.

10 Price Action Candlestick Patterns You Must Know
https://www.tradingsetupsreview.com/10-price-action-candlestick-patterns-must-know/
This article illustrates the 10 most important candlestick patterns to know including Doji, Harami, Engulfing, Hammer / Hanging Man among other. A great reference for active traders.

Technical Indicators
Oscillators
Multi Time Frame Analysis with Oscillators—Simple, Effective
http://www.tradeciety.com/multi-time-frame-analysis-with-oscillators-simple-effective/
This is a short piece on the multi time frame (MTF) analysis. Highlights that the underlying idea is to go with the larger theme on the higher time frame, and then to drill down to the lower time frame in order to gain impeccable timing and to increase the risk:reward ratio.
Argues that the best way to use MTF is through oscillators.
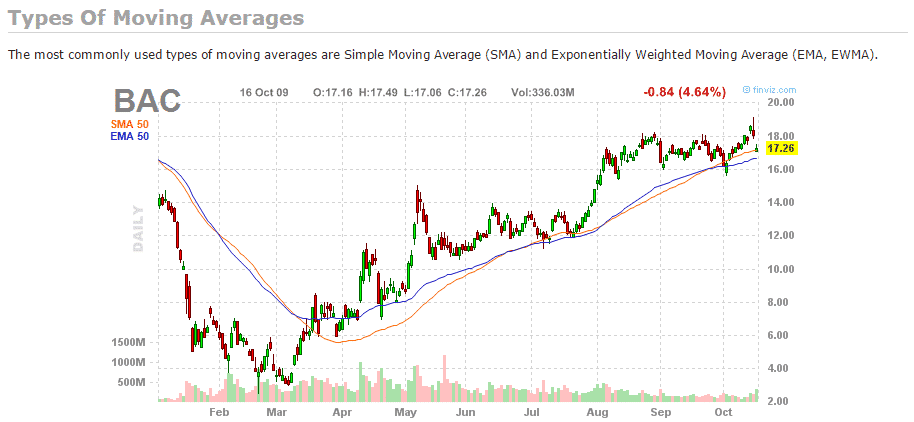
Moving Averages
http://finviz.com/help/technical-analysis/moving-averages.ashx
Argues that the moving average is one of the most flexible as well as most-commonly used technical analysis indicators due to its simplicity. Includes an introduction, purpose and use, trading signals, how to use, pros and cons, and types explanation section. It mentions simple moving average (SMA) and the exponentially weighted moving average (EMA, EWMA).
Best Day Trading Chart Indicators
https://tradingsim.com/blog/day-trading-chart-indicators/
This article argues that a beginner trader shouldn’t just search for the best trading indicators, but the best one for you. Outlines that the three components in finding the best one are: the right time frame, the right on-chart indicators, and the set of the right off-chart indicators.
Technical Analysis Tools
http://www.businesstoday.in/moneytoday/stocks/technical-analysis-tools/story/21155.html
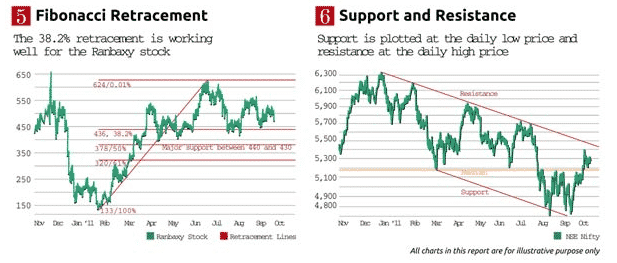
Reviews basic technical analysis, how to pick a stock, stock trends, moving averages, relative strength index (RSI), Moving Average Convergence Divergence (MACD), Fibonacci Retracement, and support and resistance.
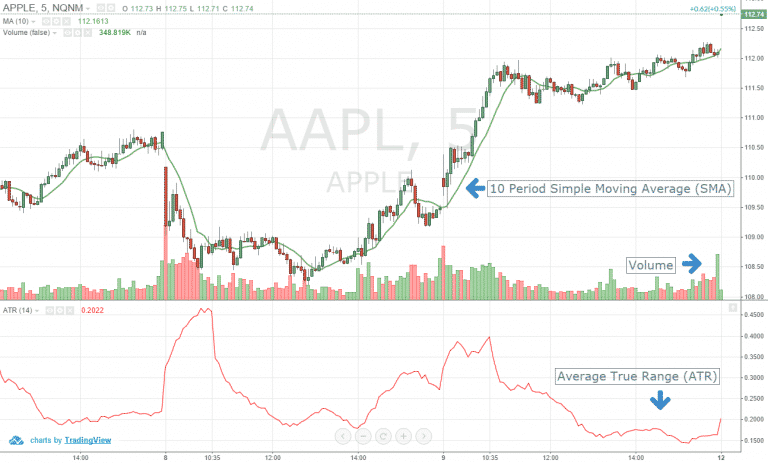
Volatility Indicators
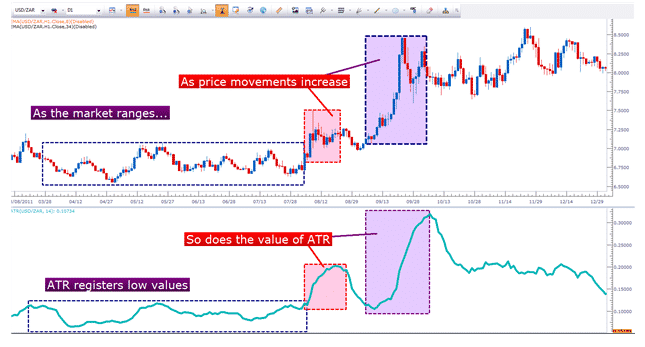
How to Measure Volatility
Defines volatility as the “measurement of price variation over a specified period of time.” And explains how traders can use historical price movements to get an idea for what may happen in the future. The article argues that the key component of this type of probabilistic approach is the ability to see the “big picture” or general condition of the market being traded. It reviews average true range (ATR) for measuring risk.
Volatility-Based Indicators
http://finviz.com/help/technical-analysis/volatility.ashx
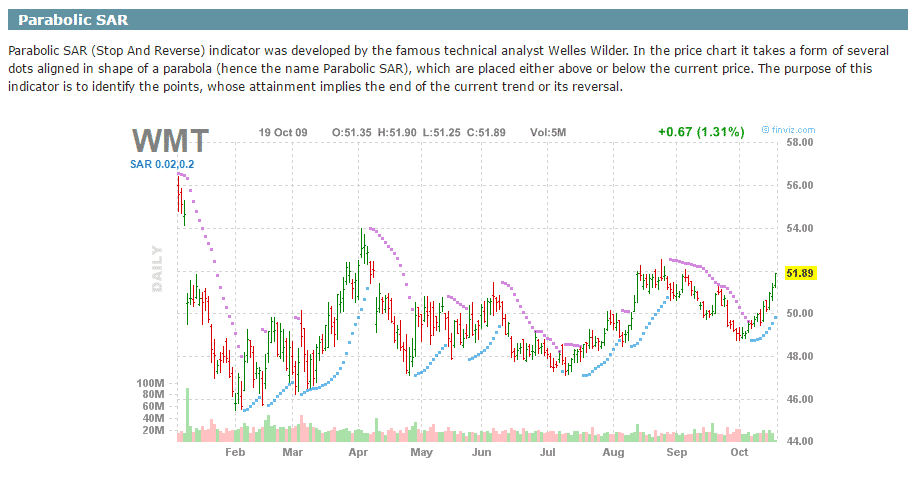
Includes a general introduction, purpose and use, trading signals, pros and cons, and types of indicators section in explaining volatility. This includes parabolic SAR, Rate of Change (ROC), and Bollinger bands,
Breadth Indicators
5 Stock Market Breadth Indicators to Make You a Better Market Timer
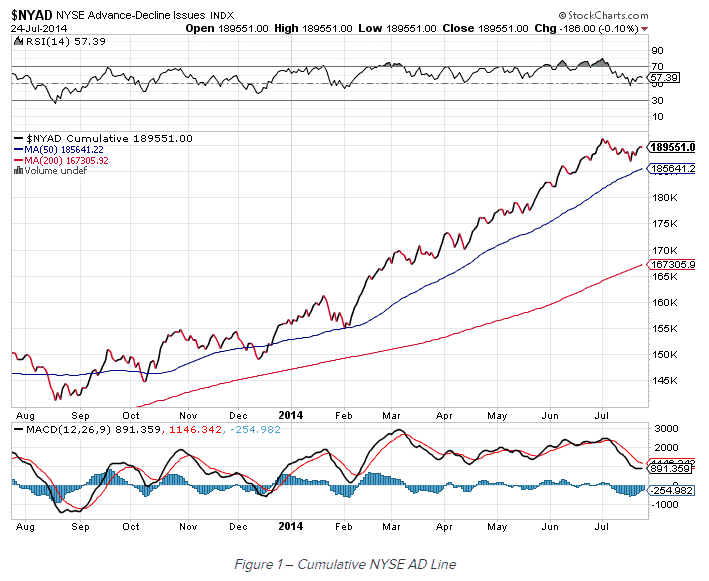
Outlines what a market breadth indicator is and how they show how the “market of stocks” is doing instead of the stock market. It explains how breadth indicators can often give information about a market move before it happens. The articles gives five examples including TICK charts, McClellan oscillator, NYSE A/D Line, cumulative A/D line, and SPXA50R.

Everything You Need to Know about Market Breadth Indicators
http://traderhq.com/everything-you-need-to-know-market-breadth-indicators/
Defines market breadth as a “technical analysis technique that compares the number of advancing securities within an index or market to the number of declining securities.” The article outlines the advance-decline index, bullish percent index, and new highs-lows index.
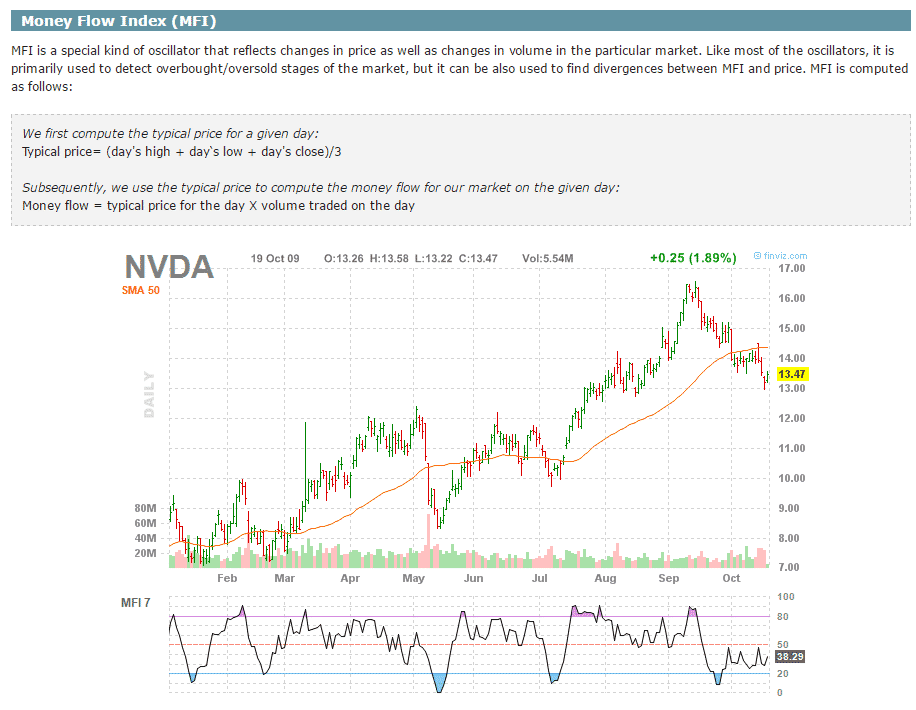
Volume Indicators
Volume-Based Indicators
http://finviz.com/help/technical-analysis/volume.ashx
Argues that the information yielded by volume-based indicators is most valuable during the last stages of a trend. Includes an introduction, purpose and use, pros and cons, and types section. Outlines the Money Flow Index (MFI) and the Force Index.
Technical Analysis Opinion Articles
Why Some Technical Analysis May Not Be Effective: An Interview with Michael Harris
This article is an interview with Price Action Lab Blogger and author who famously argues that “everything you know about technical analysis is wrong.” He explains that methods of the old school were not conceived when computers were available, so they had to be visual based on charts. He believes pattern were invented and are no longer relevant.
Trade safe!
Disclaimer: The information above is for educational purposes only and should not be treated as investment advice. The strategy presented would not be suitable for investors who are not familiar with exchange traded options. Any readers interested in this strategy should do their own research and seek advice from a licensed financial adviser.


Amazing resource Gav, thanks!
But how do we know that any of this works (or which ones work when)?
Some people swear by technical analysis, others think it’s a waste of time. I’m somewhere in between. I think it’s a great tool to use as part of an overall trading plan, but you shouldn’t rely on it being the be all and end all. Being able to read the charts and patterns will improve your trading, I have no doubt about that. But, there is not technical analysis rule that works 100% of the time.
Gavin,
Thanks for the reply. If a retail investor wanted back test some of these tools to see what indicators worked best and what settings worked best, what would be some good good ways to go about it?
Hi John,
That’s a good question. I’m sure there is software out there for backtesting, but I’ve never used any personally. Sorry I can’t be more help.
G.
Wow there are a couple of years worth of study material here. Thank you for taking the time to compile this great resource!
You’re welcome Santos. Happy studying!