


Today I stumbled upon an excellent article by Steve Blumenthal from CMG. Admittedly, the article is almost a month old, but there were some interesting takeaways that I wanted to share here on the blog.
He starts of by stating that one chart he is looking at suggests “the likely annual return for the S&P 500 Index will average just 2.25% over the next ten years.” Naturally that caught my attention and I wanted to find out more. Steve is using the percentage of household equity ownership to derive these estimated future returns.
The main argument is that when households have a high percentage of equity ownership, the future pent up demand is low. When households have a low percentage of equity ownership, the future pent up demand for stocks is high. Makes sense, right?
Steve went on to say this:
“There were just two prior periods of higher equity ownership than where we sit currently. One was the market peak in March 2000 and the other in October 2007. Unfortunately today, the percentage of household equity ownership is approaching the level reached at the market peak in 2007.”
In the chart below, you can see that from 1975 – 1990, equities as a percentage of household assets, was very low, fluctuating between 27.5% and 35%.
In terms of peaks in household equity ownership, there was a clear peak during the tech bubble when the level hit 65% and again before the financial crisis it peaked at close to 60%.
The current level is 57.5% which is the third highest peak in the last 60 years, and given the inverse correlation with equity returns, you can see on the right hand axis an expected 10 year return of just over 2%.
This isn’t to say that the ratio can’t go higher, we could even see another blow off top like in 1999, and stocks could continue rallying for the next year or so. No one knows what the future holds, but based on this chart, it appears longer term (5-10 year) equity returns are likely to be disappointing from here.
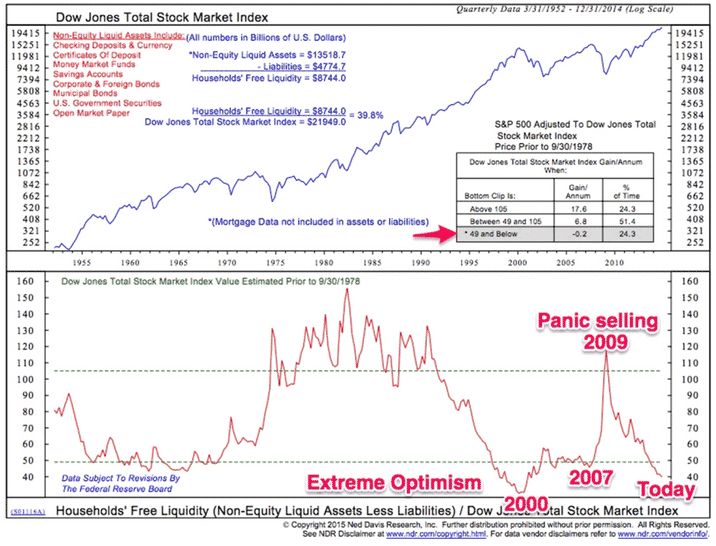
Blumenthal provides another chart illustrating “Household Liquidity”. I’ll leave you to draw your own conclusions, but it paints a similar picture to the first chart.
Great insights by Steve, I hope you found them interesting. You can read the full piece here.


Thanks for this fantastic insight.
Fortunately, for us options sellers, a sideways market is not a problem.