When starting out on their journey, beginner options traders are often daunted by the tremendous amount of information related to implied volatility.
It is a difficult task just to figure out what is important and what isn’t. There is so much to learn that it is often completely overwhelming.
One item that is particularly important to decipher is the relative values of implied volatility (IV) amongst the various strike prices and the various months of expiration.
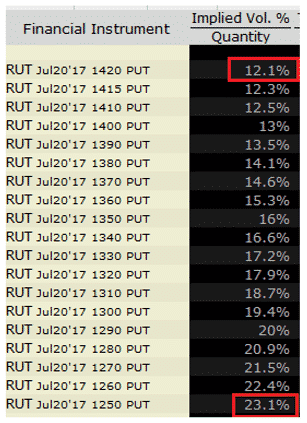
The implied volatility of each of the various available options for a given underlying is not usually constant for each individual strike price and expiration cycle. IV can vary significantly between individual strike prices within the same expiration; this variation is termed vertical skew.
You can see this below in the option chain for RUT. The at-the-money put has implied volatility of 12.1% whereas the deep out-of-the-money put has implied volatility of 23.1%.
In addition, IV often varies at the same exact strike price when considered between various expiration cycles; this variation is termed a horizontal skew.
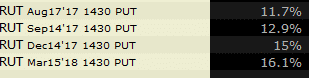
As you can see volatility is different for the same strike price across different expiry months. This is a typical market situation known as contango. Implied volatility rises going out further in time as there is more chance of a volatility spike as you go further out in time.
As a reminder, option prices depend largely on the three variables: time to expiration, price of the underlying, and IV.
The main variable that needs to estimated is implied volatility. Unlike historical volatility which is known, implied volatility is unknown. After all, no one knows what the future holds, so no one knows how volatile the stock will be over the life of the option. The best we can do is guess.
One of the main causes of horizontal skew is earnings reports. This is a huge unknown and stocks can have large percentage moves following an earnings release. For this reason, expiry months that include the earnings date will tend to have higher implied volatility than those that don’t include that date.
The bottom line is that as options traders, we need to make sure we understand all factors that can impact implied volatility and therefore the price of options.
Trade Safe!
Disclaimer: The information above is for educational purposes only and should not be treated as investment advice. The strategy presented would not be suitable for investors who are not familiar with exchange traded options. Any readers interested in this strategy should do their own research and seek advice from a licensed financial adviser.