
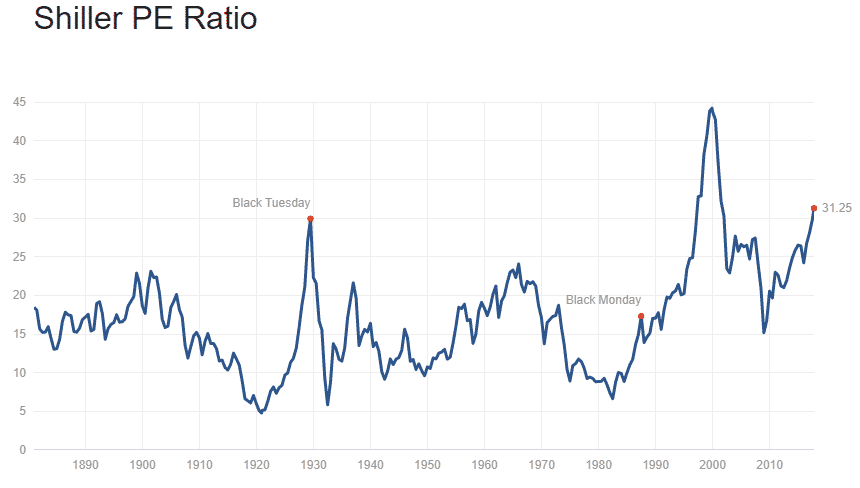
There has been a lot of talk lately about a bubble in the US equity markets and valuation measures such as the Shiller PE Ratio. I discussed this in detail in my recent post Are We Set For a 1987 Style Crash?
At the time, the Shiller PE Ratio was at 30.23, the third highest level on record behind 1929 and 2000. The ratio has since risen to 31.25 as you can see below and has now overtaken the 1929 reading.
US stocks do seem expensive here, but that certainly does not mean we can’t head much higher from here.
The amount of technological change is so rapid, that this “bubble” could continue to inflate for some time.
But, for cautious investors who prefer to invest based on value rather than hype and hope, where can we find some freakin’ value?
I did a quick search for “Emerging Market PE Ratios” and found this excellent site:
http://www.starcapital.de/research/stockmarketvaluation
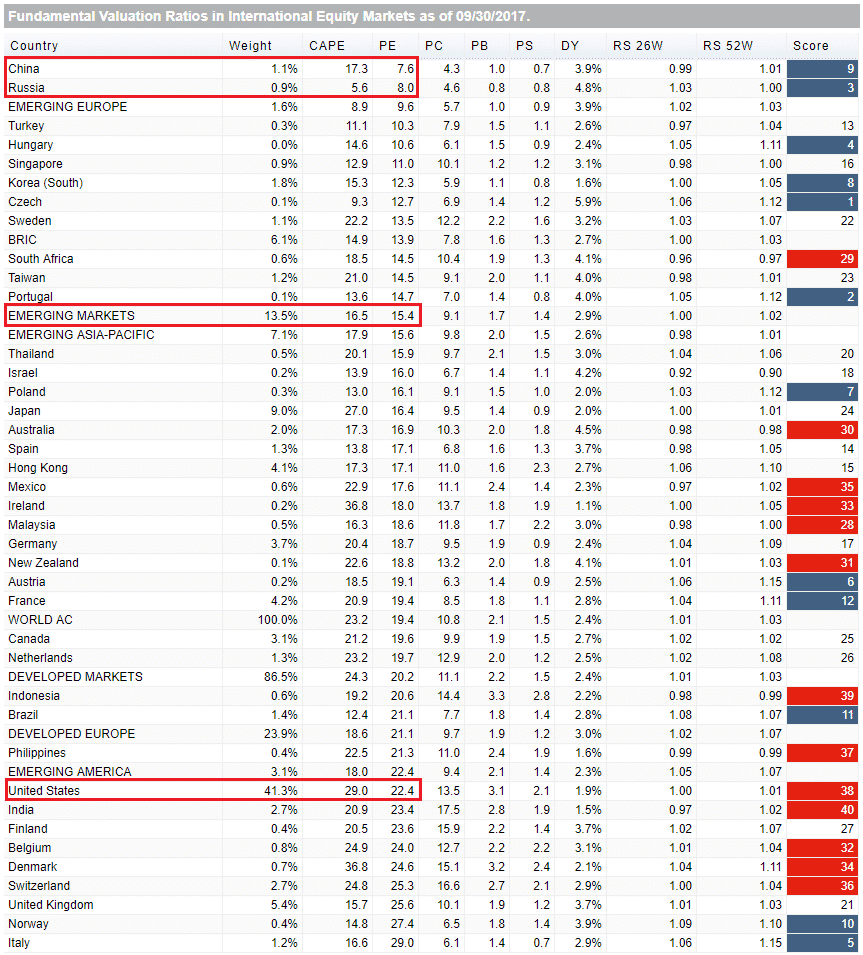
On this page, you can view the data via the map, or scroll down to the table which can be sorted based on the headings. If we sort by CAPE we see that Russia is currently the cheapest market in the world based on this valuation metric, coming in at 5.6.
The US comes in as the third most expensive with a reading of 29.0, slightly lower than the value first graph which was found at http://www.multpl.com/shiller-pe/.
If we sort by PE Ratio the US is still the ninth most expensive market behind Italy. The US PE ratio is listed as 22.4.
China at 7.6 is the cheapest with Russia second at 8.0.
![]()
How much importance investor should give this data is a question for another day, but it does demonstrate that for long-term, value investors there are still plenty of places to find value.
Emerging Markets for example at trading at a PE of 15.4. After years of underperformance, perhaps now is their time to shine? This interesting chart was shared on Twitter by @ObservationDesk.
Perhaps there is a long term trend change currently underway that would favour Emerging Markets over US stocks?

Below is a snapshot of the table mentioned sorted by PE Ratio. What do you think about this data? Let me know in the comments below.
Trade Safe!
Disclaimer: The information above is for educational purposes only and should not be treated as investment advice. The strategy presented would not be suitable for investors who are not familiar with exchange traded options. Any readers interested in this strategy should do their own research and seek advice from a licensed financial adviser.