


Today we are looking at put ratio spreads. We will look at standard 1 by 2 spreads and also 1 by 3 spreads.
We will analyze a couple of examples to lock in the learning.
Enjoy!
Contents
- Definition
- Construction
- Standard 1 By 2 Put Ratio Spread
- 1 By 3 Put Ratio Spread
- Point Of Entry / Trade Setup
- Exit Strategies
- Breakevens At Expiry
- Maximum Profit
- Margin Requirements
- Risks
- How Did These Trades Work Out?
- Another Put Ratio Spread Trade Example – OIH
- Conclusion
Definition
The put ratio spread is generally considered a neutral strategy, although it has the ability to make a profit in up, down and sideways markets.
Yes, it can make money no matter which way the market goes, the key is the timing!
The strategy involves buying a number of put options and selling more put options further out-of-the-money.
It involves naked options so may not be available or appropriate for all investors as there is unlimited risk on the downside.
The trade is placed when the trader thinks the underlying stock will be stable or slowly move lower and finish around the short put strike at expiry.
A fall in implied volatility will benefit the trade and it can also be profitable if the stock moves up early in the trade.
The big risk with the trade is a sharp move lower early in the trade.
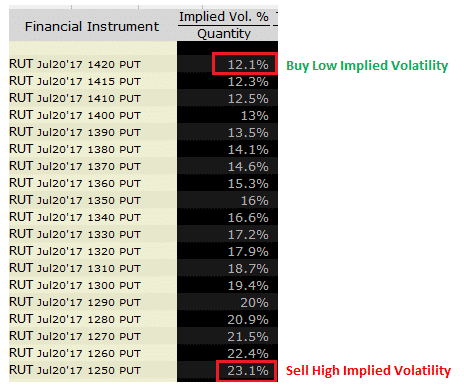
Skew can play a big part in the trade given that we are trading different put strikes.
Generally implied volatility rises as we go further away from the stock price.
Therefore, we end up selling options with higher implied volatility and the options we are buying.
This can be a good thing.
Just like stocks, we want to buy low and sell high.
Construction
The put ratio spread can be set up in a variety of different ways.
The standard set up would be to buy 1 at-the-money put and sell 2 out-of-the-money puts.
Some traders might vary the ratio by using a 1 by 3 ratio where they are selling 3 out-of-the-money puts for every 1 put purchased.
This increases the income potential in the trade, but also increases risk due to the higher number of naked puts.
Other traders might use a ratio of 2×3 or 3×5 and I’ve even used 2×5 in the past.
Let’s compare some examples visually so we can analyse the difference.
Standard 1 By 2 Put Ratio Spread
Here we have a standard 1 by 2 setup on US Steel – symbol X.
On April 29th, 2017 with X trading at $22.32, we are buying 10 of the $22 puts and selling 20 of the $20 puts.
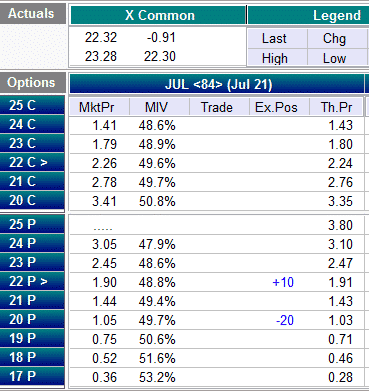
The trade is a net credit trade because we receive $200 when placing the trade.
If the stock stays flat or moves up at expiry, we make $200 income.
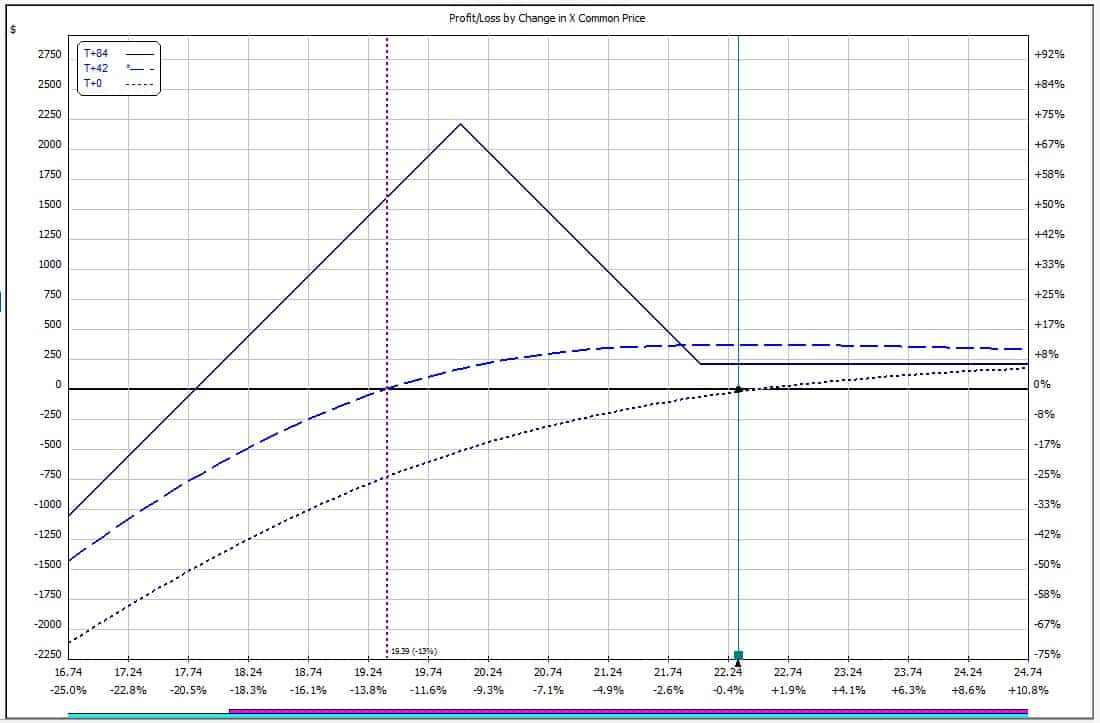
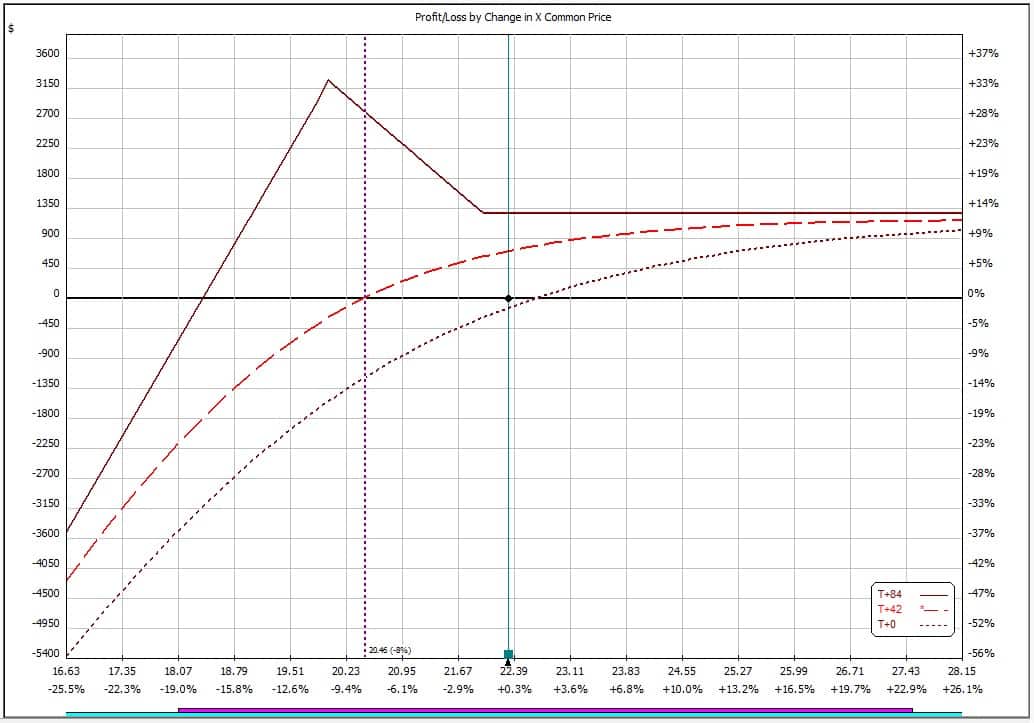
Looking at the risk graph, we can see that after 42 days (blue dashed line), the trade can potential make money if X is down, sideways or up.
The best case scenario is X being basically flat after a month and a half with no significant rise in implied volatility.
In this case we can potentially close the trade for a profit greater than the income received.
For this reason, put ratio spreads are generally considered neutral trades.
However, as you will see shortly, if we alter the setup it can take on more of a bullish or bearish profile.
Below you greeks of the trade.
While Delta is 127.5, Delta Dollars is quite low, so more or less neutral with a slight bullish bias.
The trade has negative Vega which means it will benefit from a drop in implied volatility after placing the trade.
Positive Theta means it is making money each day through time decay.
With margin requirements around $3,000 the income potential in the trade is 6.68%.
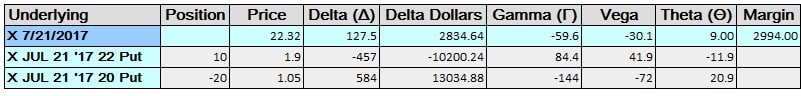
Given that implied volatility on X is high, the trade has a wide margin for error, with the trade withstanding a 20% down move into expiry.
However the stock does tend to have daily moves in the 2-3% range.
1 By 3 Put Ratio Spread
In this variation, you will immediately see that it is a riskier version of the trade given that we now have two naked puts rather than just one.
Therefore, our margin requirement and downside risk is much higher.
The trade is taking on a much more bullish bias with delta of 419 as opposed to 127.
Vega and Theta are also higher.
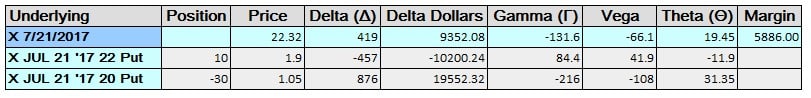
Clearly this trade performs better in a bullish environment. As with most things, increased risk also means increased profit potential.
Personally I prefer the standard 1 by 2 version of the trade.
Point Of Entry / Trade Setup
Typically I like to enter this trade after a stock has had a pretty decent decline. A great example of this is when there is an earnings drop.
There have been multiple examples of this recently which I discuss in the below video.
The thing about entering after a big drop in price is that you can take advantage of the higher levels of implied volatility.
The other time to enter this trade would be when you think the stock might drop a little bit further but not too much further over the course of the trade.
This can leave the stock sitting smack bang in the middle of the profit zone.
Exit Strategies
As with all options strategies, it’s very important to have a plan for how you are going to manage the trade once it’s placed.
On the profit side, it makes sense to exit these trades once you’ve made 25% of the maximum profit potential but it can be held until 50% if the trader chooses.
A 20% stop loss is also advisable.
If the stock does drift lower towards expiry but has not hit the stop loss, the trade can be re-opened for a future expiry.
Alternatively, the trade might choose to let some of the short puts be assigned and take ownership of the stock at a substantially reduced price than it was initially trading at.
From here the trader can start a process of selling covered calls.
Breakevens At Expiry
The breakeven price at expiry is simply the short put strike less the max profit potential divided by the number of contracts. In this case 20 – (2200 / 10 / 100) = $17.80
Maximum Profit
It’s very simple to calculate the maximum profit at expiry for a standard 1 by 2 put ratio spread.
Simply take the distance between the strikes and add the credit received. In this case 2 x 10 x 100 + 225 = $2,220
Margin Requirements
Margin requirements on a put ratio spread will vary depending on the broker and the account type.
Naked options mean high margins requirements.
Some traders may be prevented from trading this strategy unless they have the appropriate permissions in their account.
The margin requirements for the examples above were $2,994 for the 1 by 2 spread and $5,886 for the 1 by 3 spread.
Having more naked options in the trade significantly increases the margin requirement.
This margin requirement may also change as time passes.
Risks
The major risk in the trade is that the stock suffers a sharp decline early in the trade.
This can see the trader stuck with a high unrealized loss and a dilemma of whether to stick with the trade and let time decay do it’s thing, or face further losses if the stock continues its downward momentum.
Early assignment can be a risk when trading stocks.
While this is possible at any time, it generally only occurs when a short put goes deep in-the-money.
In this case, the trader would likely have exited the trade for a loss before that occurred.
How Did These Trades Work Out?
In short, very well, but it wasn’t all smooth sailing.
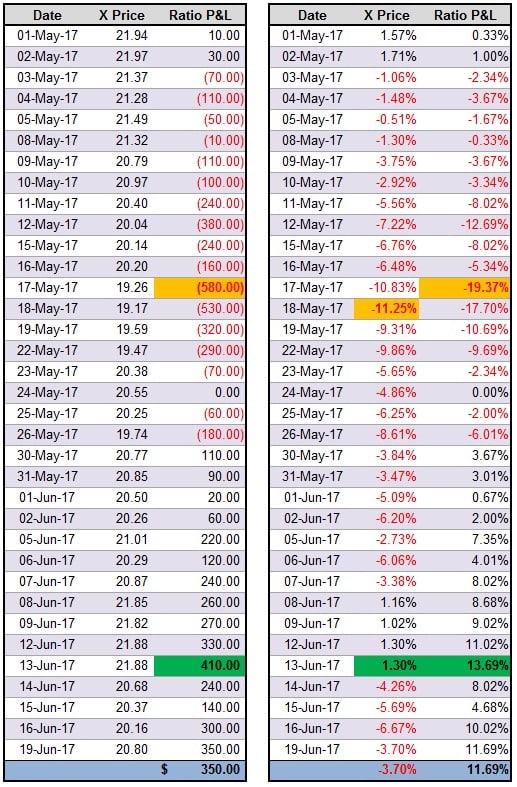
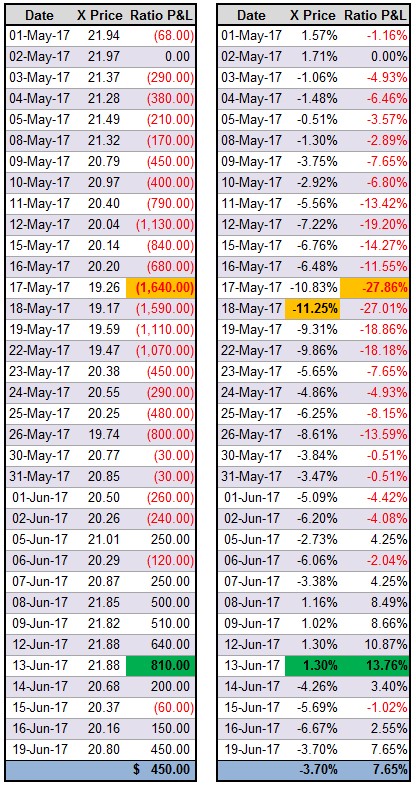
Taking the 1 by 2 ratio spread first, the trade lost money almost from day one as the stock declined as much as 11.25%.
The highest unrealized loss on a closing basis was on May 17th when the trade was -$580 or -19.37% based on capital at risk (margin).
This is very close to the 20% stop loss recommended above.
From there, the stock started to recover and the trade then performed really strongly with the highest gain coming on June 13th with the stock up 1.30% since trade initiation and the ratio spread +$410 or 13.69%.
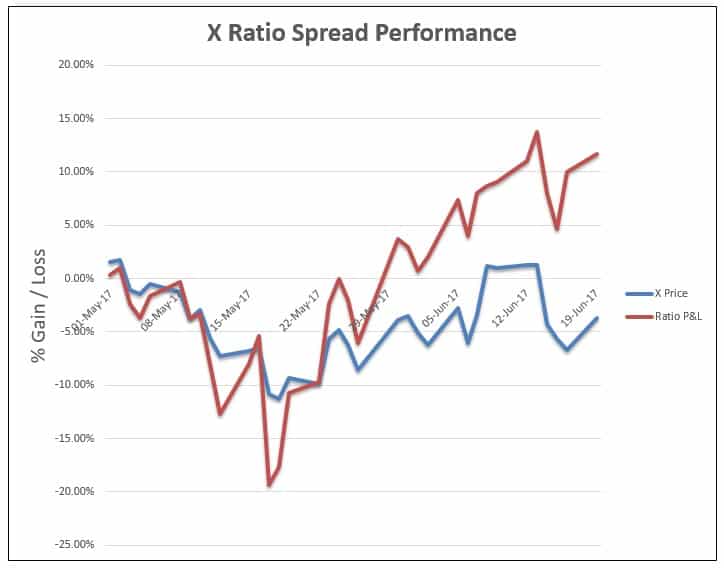
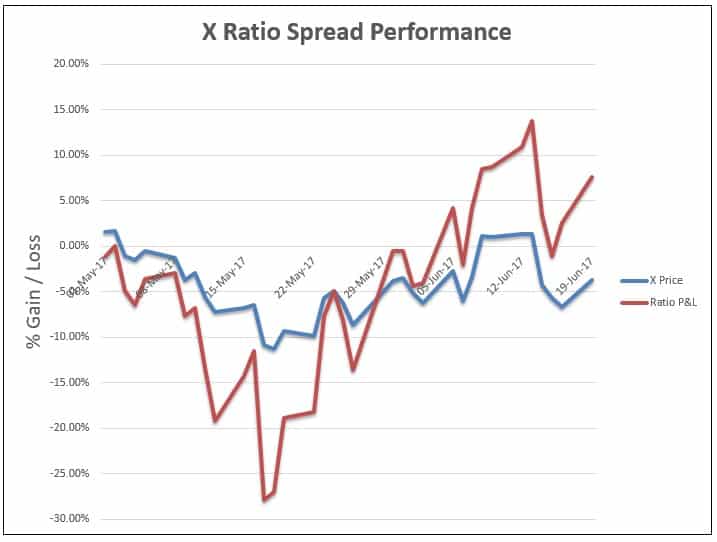
The graph below depicts the performance of the put ratio spread in comparison to the stock price.
Notice the under-performance of the ratio spread early in the trade as the stock declines.
Then, as the stock recovers, the spread trade starts to pick up gains at a rapid rate.
Remember that time decay starts to accelerate as the trade progresses.
This trade started out with a Theta value of 9 and by June 19th, that Theta value has increased to 19.
As time progresses, the further out-of-the-money short put is going to decay at a faster rate than the long put.
X Put Ratio Spread Performance
The 1 by 3 trade did not work out quite as well.
This is to be expected given the stock initially declined 11% and this trade had an extra naked put.
The highest unrealized loss was $1,640 on May 17th which represented 27.8% of capital at risk.
Based on the suggested stop loss of 20%, this trade would have been closed on this date.
However, if we continue to follow the trade, it did come back into profit and was showing a $810 gain on June 13th.
This represents a 13.76% return on capital compared to a +1.30% move in the underlying stock.
There is definitely more volatility and variation in P&L with this version of the trade which is why I prefer the 1 by 2 version.
This US Steel ratio spreads have another month until expiry, so I’ll aim to provide a further update in a few weeks.
There is definitely some concern given that last week an analyst put out some very negative guidance on the stock and suggested that earnings could drop by as much as 28% next quarter.
Also, implied volatility is still elevated at 58%, so it’s a high risk stock and trade.
Check back in a few weeks for an update.
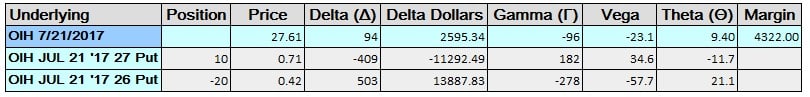
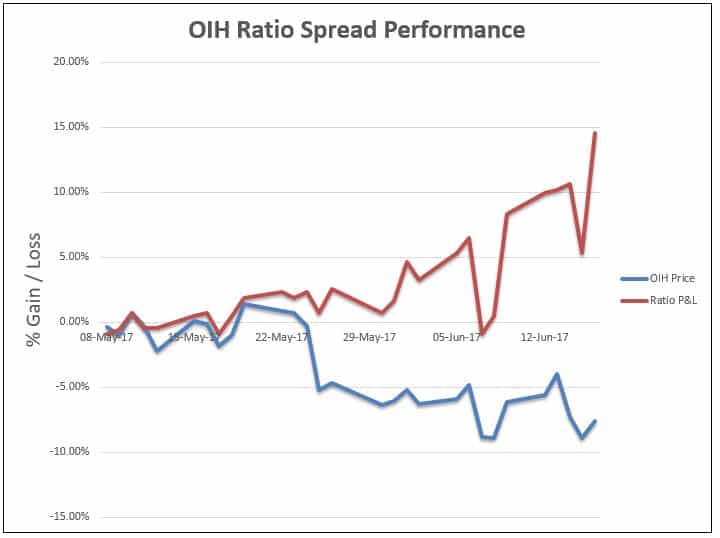
Another Put Ratio Spread Trade Example – OIH
Earlier in this post I linked to a put ratio spread trade example using 4×10 ratio. Now let’s take a look at a third example using OIH.
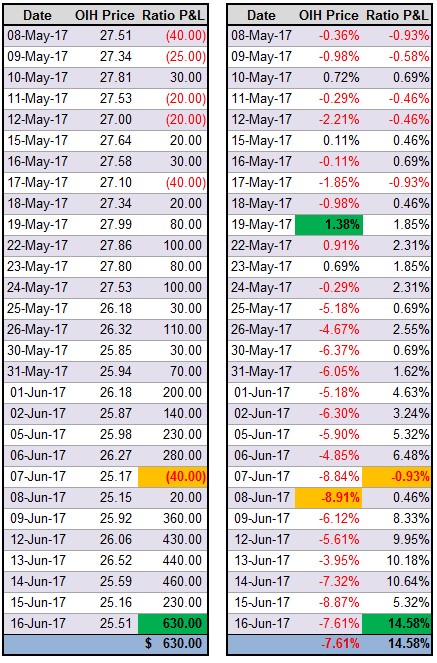
This trade was initiated on May 8th with OIH trading at $27.61.

The trade moved pretty slowly to start with, fluctuating between -$40 and +$110 for the first 17 trading days.
One interesting thing to note is that on May25th when OIH dropped 5.18%, the ratio spread only dropped from +$100 to +$30.
If held to expiry, the trade would have made $630 for a return of +14.58% compared to the stock which returned -7.61% in the same period.
The gains really picked up steam in that last week, but risks are also very high in that last week.
I actually closed the trade on June 13th for a gain of $440.
It was right in the middle of the profit zone and I was concerned that the profits would evaporate if OIH declined into expiry.
I also didn’t want the risk of getting assigned, so I closed the trade and rolled it out to July.
Conclusion
Put ratio spreads are a powerful strategy that have the potential to profit in up, down and sideways markets.
The big risk in the trade is the stock making a sharp move lower early in the trade due to the naked put embedded in the trade.
A 1 by 2 ratio spread is the standard set up, but it can be set up other ratios such as 1 by 3 in order to take a more directional exposure, however the risks on the downside are higher due to the additional naked put.
From the two 1 by 2 ratio spread examples, we saw that the ratio spread followed the stock price.
Let me know what you think about this strategy in the comments below.
Trade safe!
Disclaimer: The information above is for educational purposes only and should not be treated as investment advice. The strategy presented would not be suitable for investors who are not familiar with exchange traded options. Any readers interested in this strategy should do their own research and seek advice from a licensed financial adviser.


Thanks for explaining this strategy so well. Have you done this with a smaller number of contracts, say 5 long puts paired with 10 short puts?
Yep, smaller contract equals less profits but also less risk. Definitely advisable to start with small contracts first until you have a feel for it.
I may look at adding to the post a section on how to determine position size, so thanks for the question.
this is the kind of stuff i’m looking to learn. I’m not ready yet though. i need to focus on mastering the basics and terminology. thank you for putting this out there.
Yeah take it a step at a time Tim. This particular strategy is kind of advanced, so definitely get the basics mastered first. Maybe bookmark this page and set a reminder to come back and read it again in 6 months.
Also, let me know if you have any other questions on getting started.
Gav.
Great write up Gav. What would be your rationale for choosing a Put Ratio over other long delta, short vega strategies like bullish broken wing butterfly or bull put spread?
Hi Gavin,
I’ve been trading Call ratio spreads instead of puts because if there is a crash they protect the downside and I sleep better knowing that. So my risk is from the current upwards theme of the indices, forcing regular adjustments… I have even thought about tossing in a few Put ratios or a double similar an Iron Condor, and looks like the legs can be further out. Your thoughts pls?
Thanks so much for what you do…
Hi Jerry, yep, the put ratios have “crash risk” for sure. Skew is advantageous on the put side, but I can understand why you would prefer the calls, but markets have been “crashing up” recently so yes, some protection or offsetting trades would definitely be a wise move.