A couple of great charts came across my desk this week, so I wanted to share them with you.
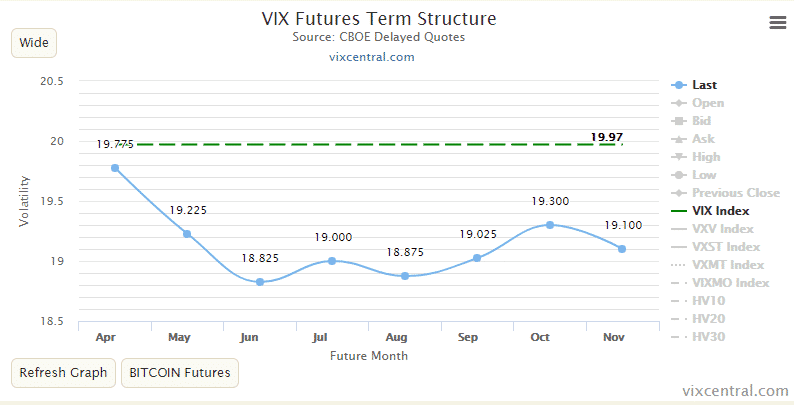
1. VIX Futures Curve
Despite the gains made on Thursday, we’re still in an environment of backwardation which can mean it’s not quite time to get back into full bullish mode just yet. Keep an eye on when this one flips to contango.
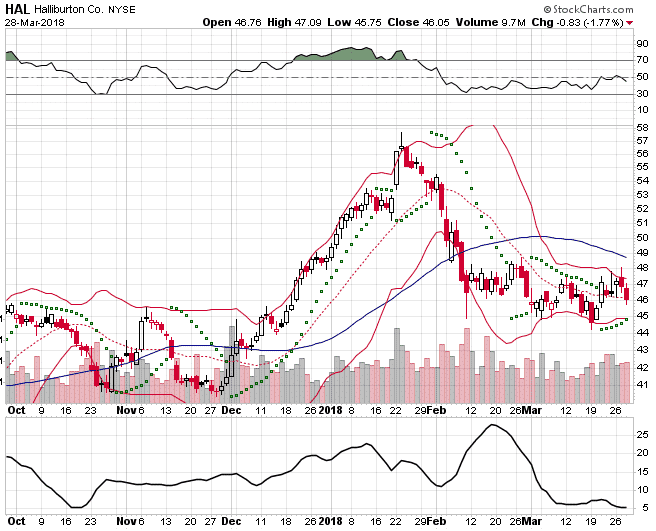
2. Haliburton
Very tight Bollinger Bands on this one, look for a potential breakout in either direction soon.
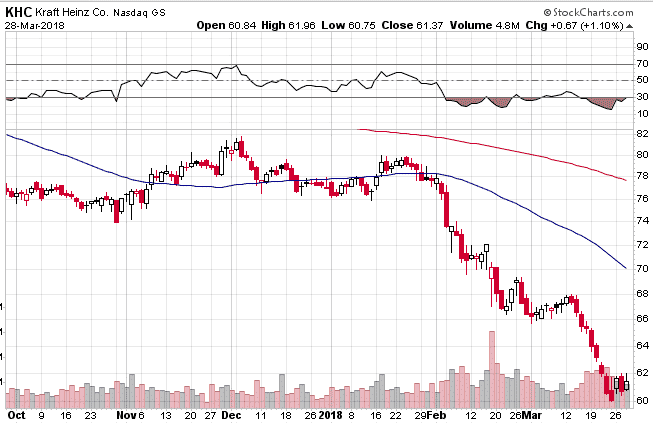
3. Kraft Heinz Co.
Defensive name with a good dividend that is deeply oversold. Starting to get interested here.
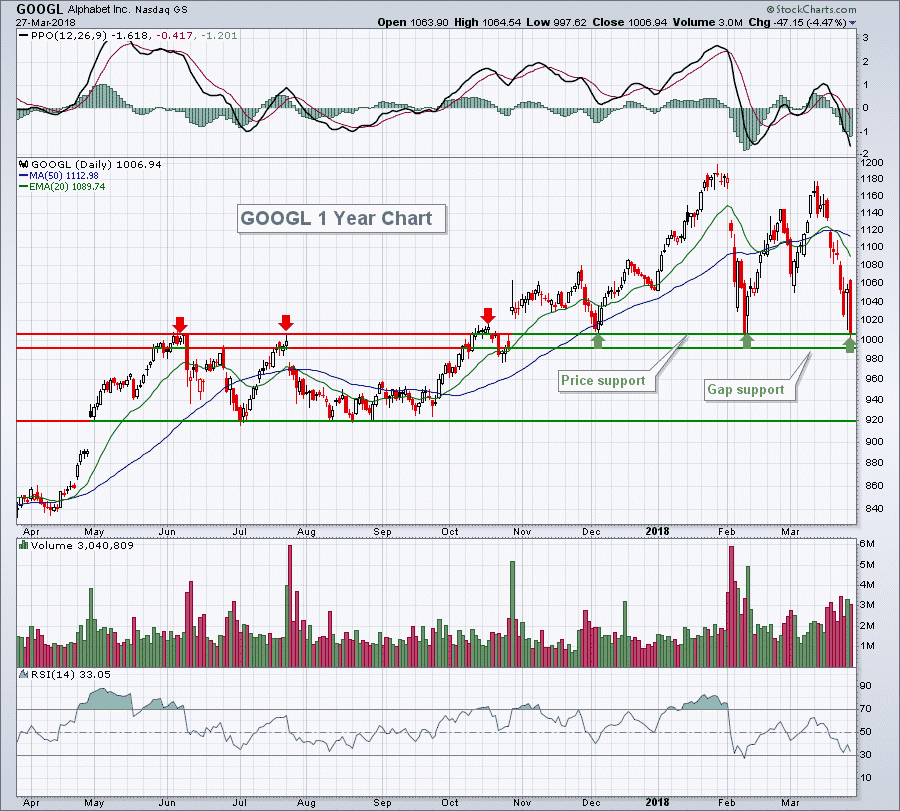
4. GOOGL
Very strong support around $1000, then below that, not much until $920.
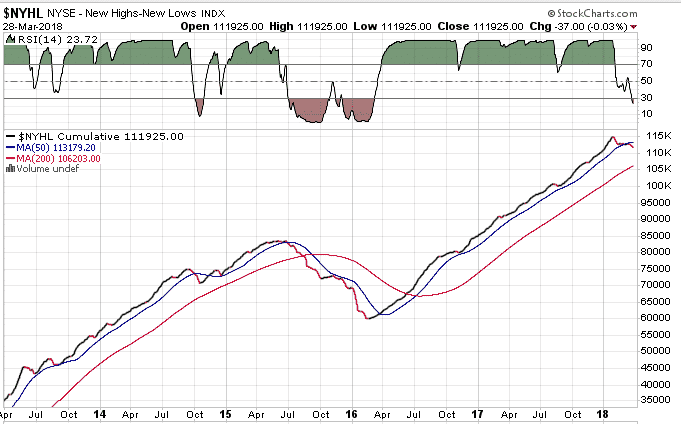
5. NYHL
Crossed below the 50 period moving average for the first time in a while. Bulls will want to recapture that level quickly.
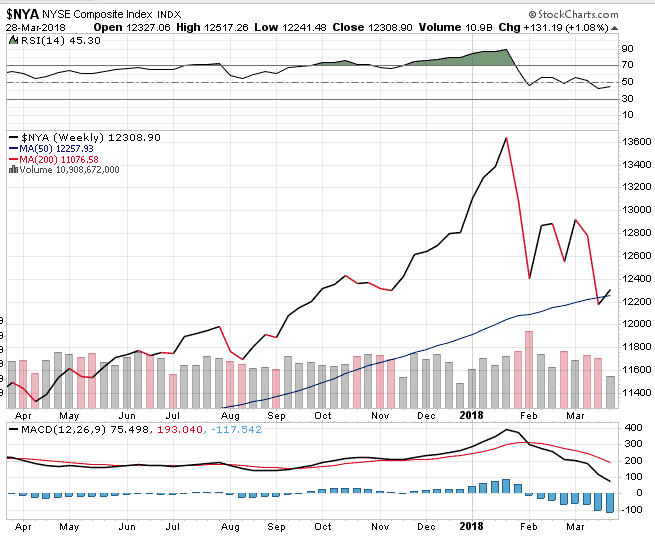
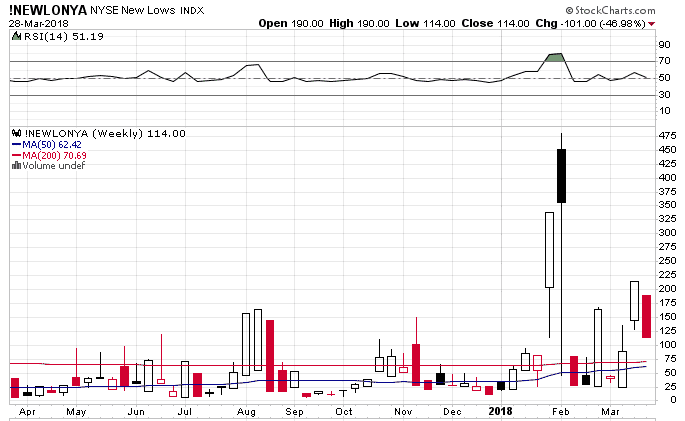
6. $NYA and !NEWLONYA
Nice divergence here that predicted the rally on Thursday. Stocks in general were making new lows, but the number of stocks making new lows was declining.
Hat tip to Mark Arbeter and Tom Bowley for some of these.
Trade safe!
Disclaimer: The information above is for educational purposes only and should not be treated as investment advice. The strategy presented would not be suitable for investors who are not familiar with exchange traded options. Any readers interested in this strategy should do their own research and seek advice from a licensed financial adviser.