
There are a number of techniques that investors can use to determine the sentiment of a broader market or a financial security. Sentiment is a measure of investor confidence in a market. Positive sentiment is associated with increasing prices where negative sentiment is correlated to decreasing prices.
The combination of price action and volume help measure sentiment and can be used to measure sentiment. One of the most interesting ways to measure negative market sentiment is to define distribution periods.
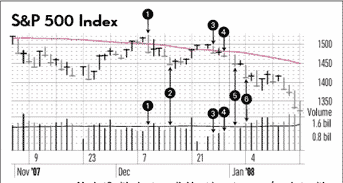
Distribution days are a sign that the big players in the market are starting to take profits and unwind their positions. This can be measured by using a combination of price movements and volume. By measuring distribution a retail investor can avoid a situation where large players are selling stock to smaller players who are just entering the market. Once the big institutions start to leave the market, retail investors are left to direct price action.
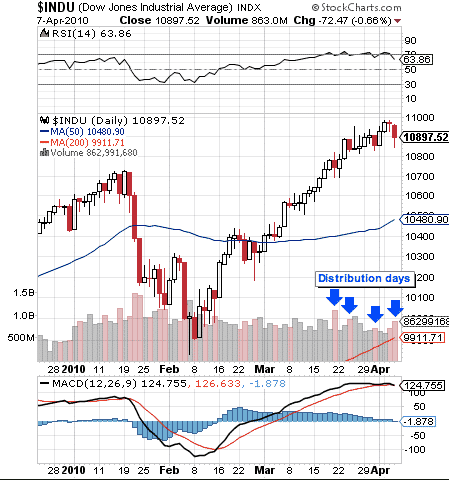
According to Investor’s Business Daily, a distribution day is defined as “the loss of more than 0.2% by a major index (Nasdaq, the NYSE composite or the S&P 500) while volume ticks higher than the prior session’s total. Tracking the accumulated damage is crucial to gauging a market’s health. Institutions are the heavyweights that largely determine the market’s direction. They account for perhaps 75% of daily trading. In a nutshell, when they buy, or accumulate stocks, the market goes up. When they sell, the market falls.”
Distribution Days – Lower close on higher volume. Image Credit – education.investors.com
An investor can use distribution days to create an index or follow distribution ratings such as the one put out by Investor’s Business Daily. The IBD rating uses a formula to measure distribution from A-F, where F = heavy selling by institutions and an A = heavy buying by investors. IBD uses their rating on stocks as well as major indices.
This article explains a little bit more about how IBD calculated distribution days.
When a market is edging higher while distribution is taking place a retail investor should be cognizant that the resistance taking place will likely turn into market liquidation when the last buyer has purchase a stock.
Investors can use distribution days to create an index that will give them a warning sign that a market is turning. For example, when a security or index experiences 3 distribution days in a row an investor can determine that the security or index is experiencing negative momentum. IBD counts distribution days but not in consecutive order. They have determined that 6-7 over the course of a month reflect a warning sign to investors that a market is vulnerable.
Multiple distribution days do not necessarily mean a market is going to move lower. According to IBD there are a number of ways distribution day count can be terminated.
The first way a distribution day is terminated according to IBD is by the calendar. After 25 trading sessions, a distribution day expires. The count of distribution days reverts back to zero. A second way a distribution day count can terminate is for the index to rise 6%, on an intraday basis, from its close on the day the higher-volume loss appears. The third way is far more painful. A broad market correction makes the distribution day count a moot point. Often, a high distribution day count will foreshadow a correction.
Distribution is a sign of market sentiment and can be a useful tool to help an investor exit positions or hedge in light that an impending correction is imminent.