
A few people recently have asked me about double calendar spreads and double diagonals, so I thought it would be a good time for another case study.
I’m choosing Goldman Sachs because they have earnings set for July 17th.
With both double calendars and double diagonals, traders sell front month options and buy back month options. They are both essentially volatility plays in that they are long Vega, but there is an added complexity in that we are trading two different expiry months on the volatility curve.
Being short the front month options, we want front month volatility to drop and back month volatility to rise or at least stay steady.
That’s why looking at earnings dates can be important.
In the following case studies, we are short the June options which will expire before the earnings announcement. The July options will hopefully hold their value due to the earnings announcement falling within that cycle.
DOUBLE DIAGONAL TRADE SETUP
Sell June 15th, 2018 220 Put @ $2.73. IV = 24.40%
Buy July 20th, 2018 215 Put @ $3.56. IV = 24.00%
Sell June 15th, 2018 245 Call @ $2.65. IV = 21.50%
Buy July 20th, 2018 250 Call @ $3.54. IV = 21.90%
Net Debit: $175
Capital at Risk: $675
You can see above that we are actually paying less in IV for the July options compared to June (buying 24.00% IV, selling 24.40% IV).
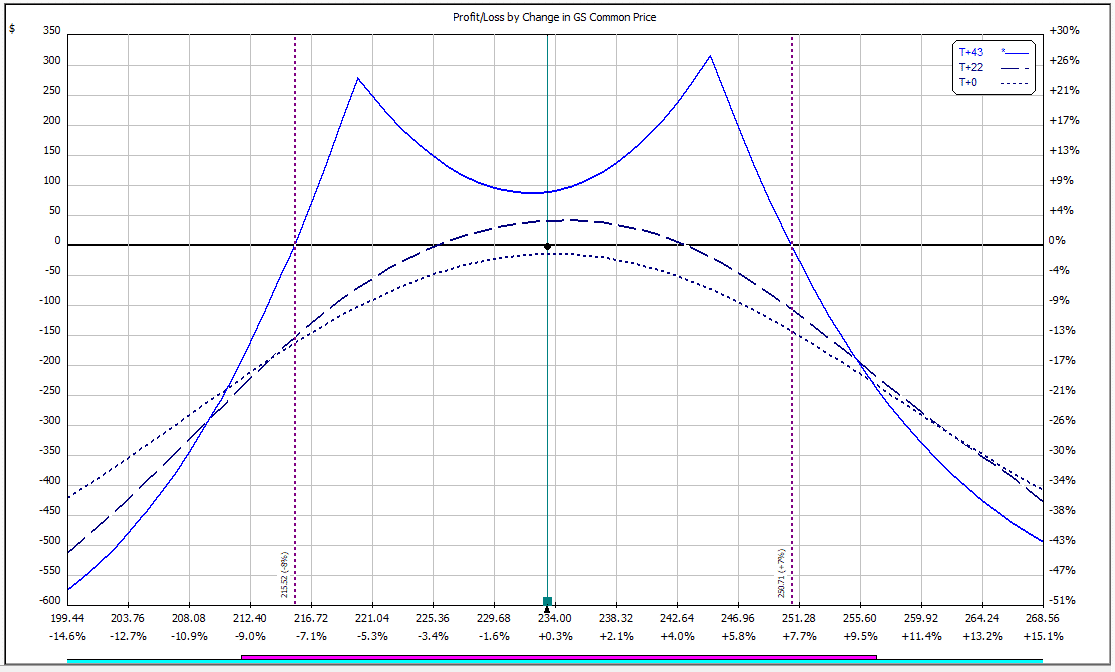
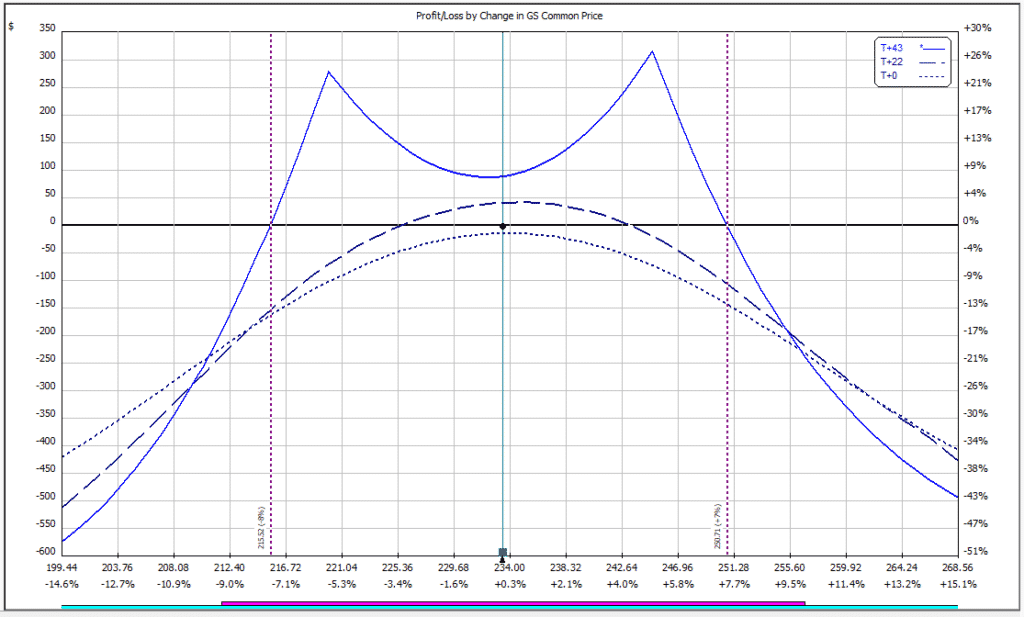
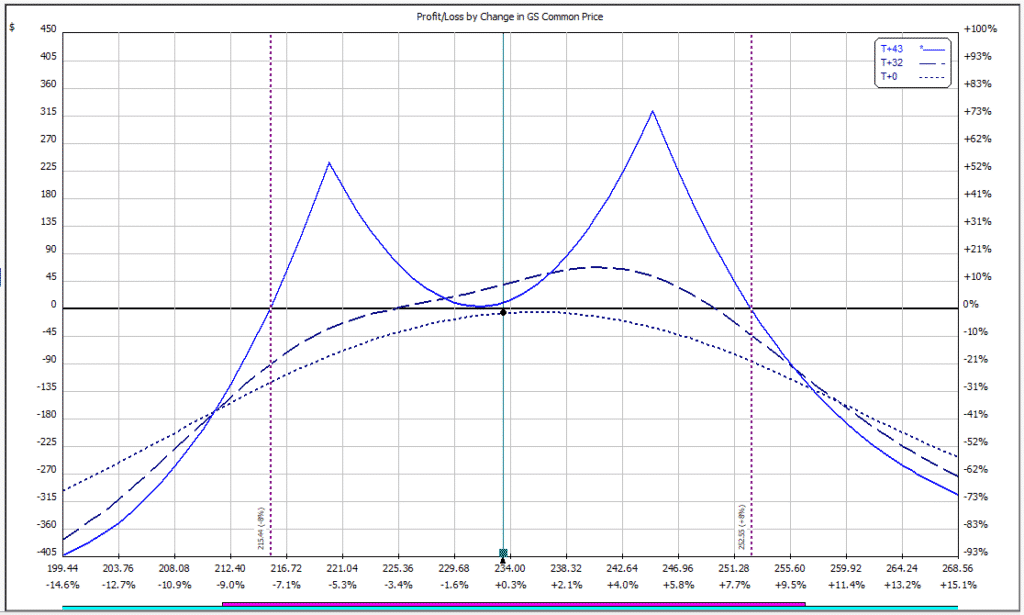
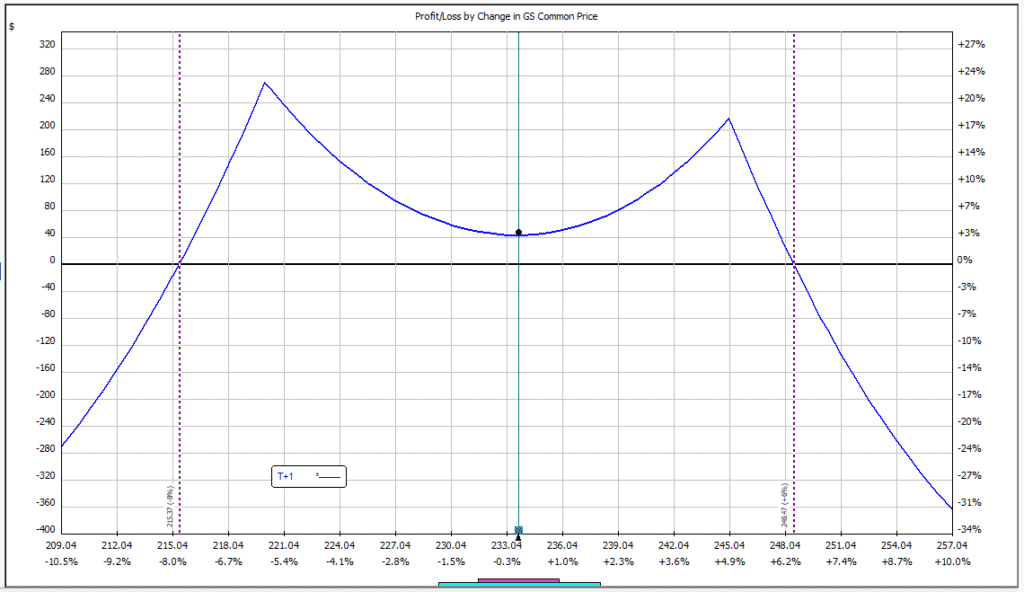
The below payoff diagram shows the two profit peaks at $220 and $245 which is 5.75% below and 5% above the current price of 233.41.
The profit potential at the mid-point of the graph is around $90 which represents a 13.33% return on the $675 capital at risk.
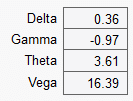
DOUBLE DIAGONAL GREEKS
Looking at the greeks for the trade, Delta is flat at 0.36, Vega is 16.39 and Theta is 3.61. Vega is the biggest driver of the trade initially, but a rise in volatility won’t necessarily benefit the trade, it depends on how the volatility rise impacts the different expiry months.
For example, if the June and July implied volatility rises by the same amount, the net benefit to the trade will be zero.
You can watch this short video below if you want to learn a bit more about fancy topics like contango, backwardation and the volatility curve structure.
DOUBLE CALENDAR TRADE SETUP
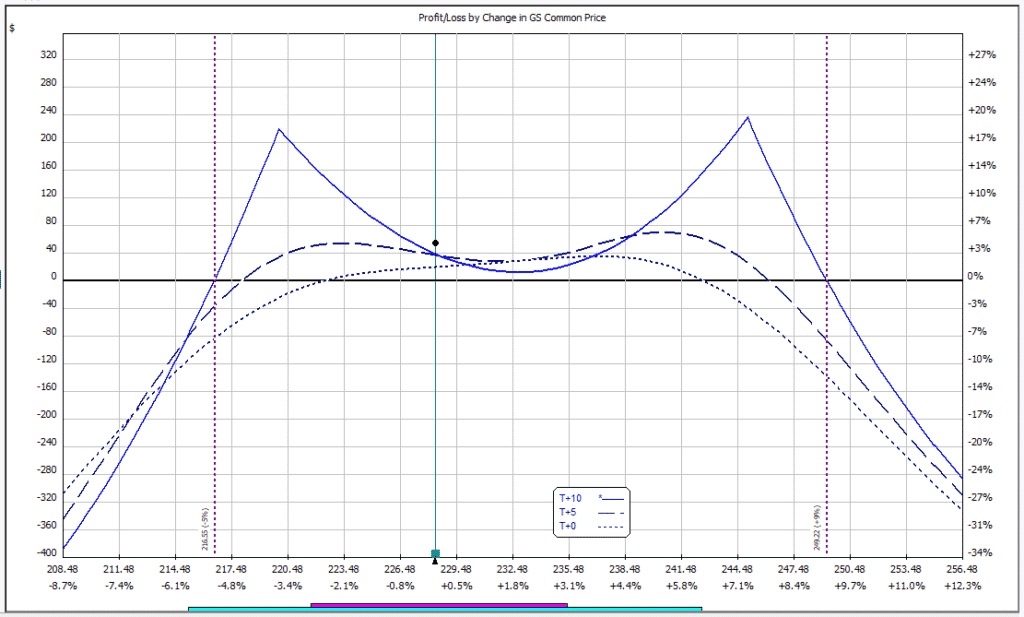
With the double calendar, I had to go a little closer with the strikes otherwise the middle of the payoff graph sagged too much in the middle and there wasn’t much profit potential in the event of a flat market.
So instead of being short the 220 puts and 245 calls, for the double calendar we are short the 225 puts and the 240 calls which means a narrower profit zone.
Because we are trading the same strike price, the max loss is contained to the amount of capital required to place the trade, in this case $493.
Sell June 15th, 2018 225 Put @ $4.02. IV = 23.60%
Buy July 20th, 2018 225 Put @ $6.26. IV = 23.70%
Sell June 15th, 2018 240 Call @ $4.21. IV = 22.00%
Buy July 20th, 2018 240 Call @ $6.87. IV = 22.40%
Net Debit: $493
Capital at Risk: $493
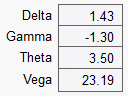
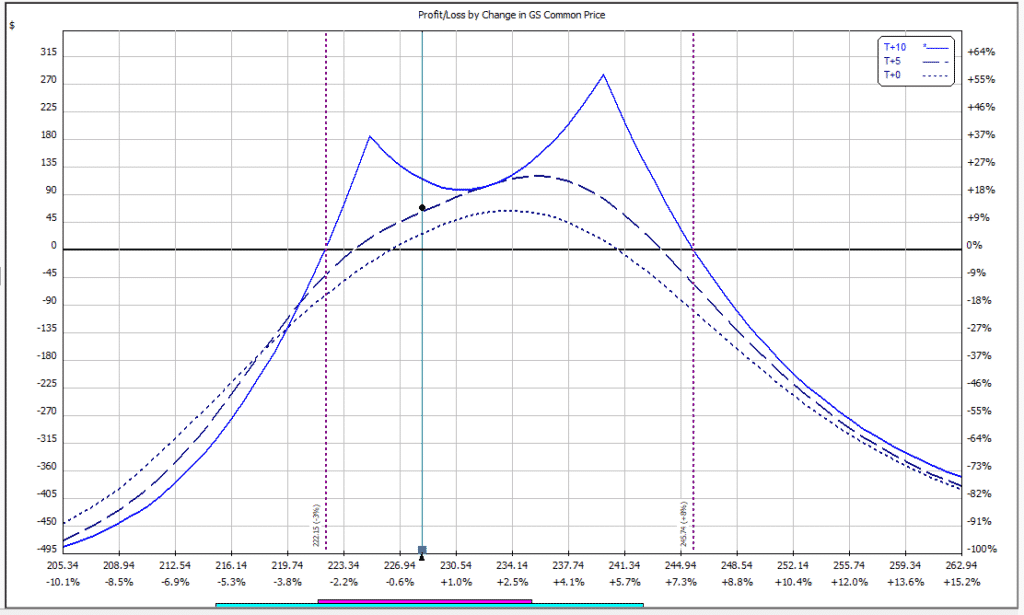
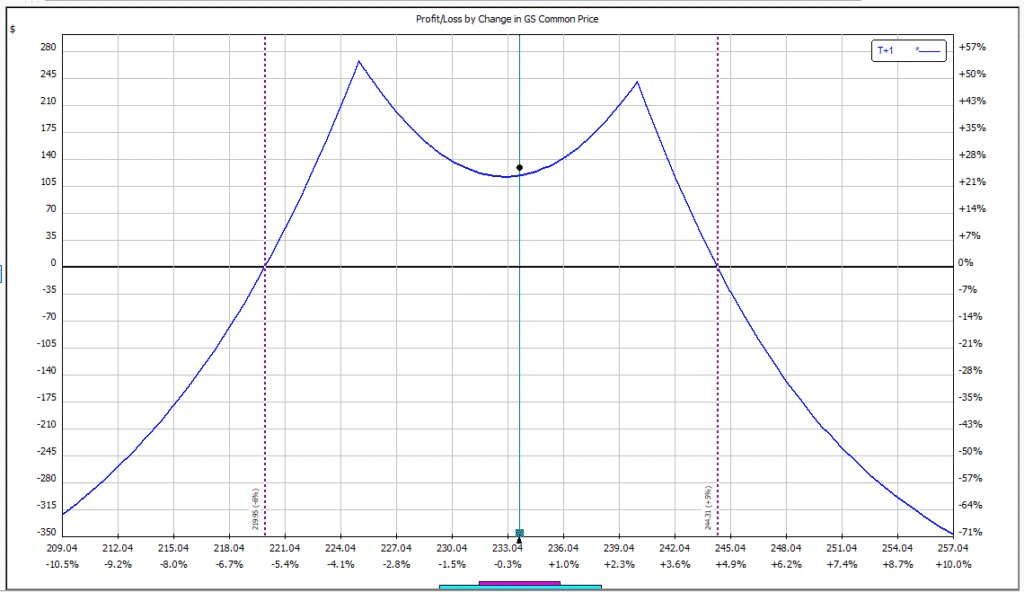
The payoff diagram below shows a similar but slightly different shape to the double diagonal. There is less of a dip in the middle so the profit potential in a flat market is a bit higher.
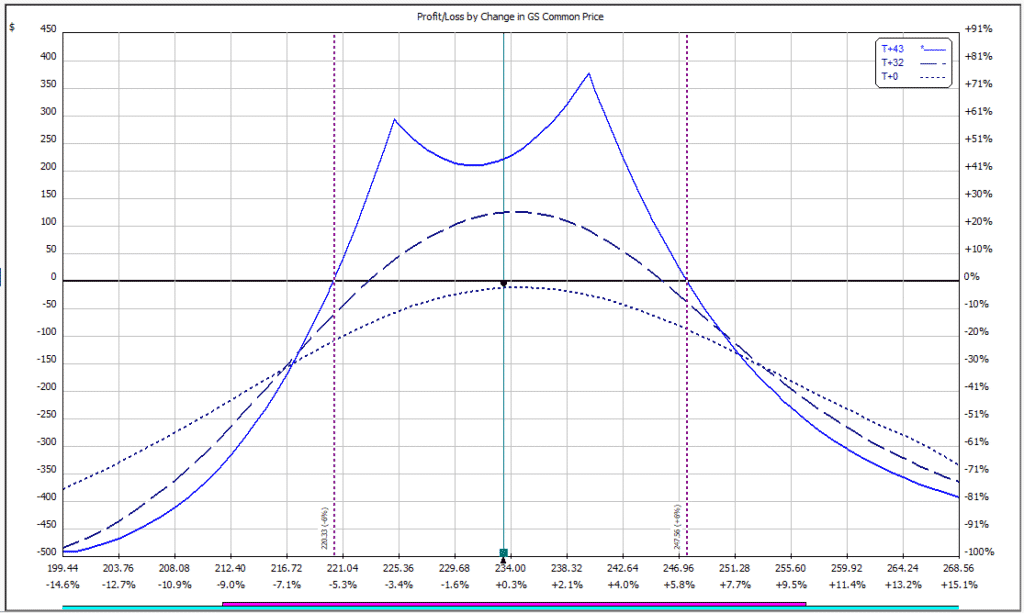
The trade off is that we had to bring the short strikes in a bit closer. This is what the trade would look like if we left the short strikes at $220 and $245. We might end up following all 3 trades just for the heck of it.
DOUBLE CALENDAR GREEKS
Greeks are pretty similar to the double diagonal trade, so I’m not expecting there to be a huge difference in the two trades, at least initially.
Be sure to bookmark this page and check back in a few weeks because I’ll be providing regular updates on how the trade progress.
JUNE 5TH UPDATE
Since entering the trade, GS has moved from $233.41 to $228.34. Implied volatility has stayed pretty steady.
DOUBLE DIAGONAL UPDATE
Here is the initial trade from May 3rd:
As of today, the trade looks like this:
The trade has made a nice profit of $55 or about 8.16%.
DOUBLE CALENDAR UPDATE
Here is the initial trade from May 3rd:
As of today, the trade looks like this:
The double calendar position is doing slightly better at +$70 or 14.20%. This trade had a slightly lower margin requirement resulting in the better percentage return.
There is still a bit more profit potential in the trades over the next week or so.
JUNE 15TH UPDATE
Another 11 days have past and it’s now expiry time, so let’s check in on our trades. GS closed at $233.65, basically the exact same spot it was 11 days ago.
DOUBLE DIAGONAL UPDATE
With GS finishing right in the middle of our strikes, the trade was +$48 or 7.11%
DOUBLE CALENDAR UPDATE
The Double Calendar trade did quite a lot better finishing +$130 or 26.37%.
Trade safe!
Disclaimer: The information above is for educational purposes only and should not be treated as investment advice. The strategy presented would not be suitable for investors who are not familiar with exchange traded options. Any readers interested in this strategy should do their own research and seek advice from a licensed financial adviser.